Fundamentals
As discussed back in mid-June, the market has been tracking along
with my weekly cyclical pressure gauge (6/15 post) in a dogged
fashion. Even the July / early August rally reflected upticks in the
gauge on a significant bounce in sensitive materials prices. the
gauge has dropped sharply over the past two weeks on rising
unemployment insurance claims and a settling down of basic
materials spot prices and is now back where it was in early July.
This kind of tracking represents a wicked game because of the
variability of weekly data and the speed with which the trend can
change. Reminds one of squirrels racing around a tree: The oil
guys chase after the stock traders and vice versa. In yesterday's
post, I discussed how quickly trend can change in the bond
market as well, since the bond guys watch most elements of the
weekly cycle pressure data, too.
The intensity of the focus on short term economic data directly
reflects interest in whether the economy is set to experience a short
slowdown or whether something more serious and darker may be
in store.
Technical
There is a confirmed shorter term downtrend underway, but what
concerns me most at this juncture is that the market has weakened
enough in August to call into question the legitimacy of the rally that
started in early July and which I thought might well have marked a
clear bottom following the deep correction over May / June. I am
not suggesting further, more serious weakness. My point is rather
that a rally from here would suggest both mediocrity and volatility
and not the sort of brisk march up that would inspire much trader
confidence. SP 500 chart.

Friday, August 20, 2010


Thursday, August 19, 2010
Long Treasury Bond
Since late 2008, the long Treasury yield has had two anchors: The
Fed's ZIRP policy for short rates and low or non-existent inflation.
The Fed maintains that it intends to keep short term rates either
at zero or nominal levels for an extended period of time, and the
CPI, although having risen from its cyclical low since the economy
started to recover, remains below the all time peak level set in
mid-2008.
The 30 yr Treasury yield did rise sharply from exceptionally
depressed levels at the end of 2008 with the uptrend continuing
right on into April, 2010. The market responded to the development
of economic recovery and sharp rises in all the cyclical pressure
gauges, with the yield running up to 4.8%.
The yield has fallen sharply since then as the leading economic
indicators have weakened and the cycle pressure gauges have eased.
Moreover, the market is now anticipating further weakness in the
economy and a likely continuing deceleration of inflation pressure.
In fact, bond market players may now be expecting that the CPI
could again go negative yr/yr on a further slowdown of the
economy.
The Treasury is overbought on technical and fundamental grounds
but the rally action is not irrational as the market is discounting
further economic weakness and is growing more confident that the
economy is near to leveling off or worse.
The trick, if you are invested in or are long the bond market on a
trade, is to realize that the market can turn on a dime if data
pointing to a fresh bounce in the economy are reported. Not only
that, but yields can run up very quickly if players perceive a
change in economic momentum to the positive. You need to pay
even closer attention now, because the Treasury market has
started to run ahead of the fundamentals, however muted they
presently are.
There has been much talk again recently about whether the
Treasury market is a bubble market. I do not find such discussions
to be useful. To be a bear on Treasuries translates into expecting
economic growth that will bring increased inflation and eventual
higher short term interest rates that will trigger substantially
higher bond yields. For that we need to see signs that the
economy is set to experience a re-acceleration of growth.
30 yr Treasury yield chart.
Fed's ZIRP policy for short rates and low or non-existent inflation.
The Fed maintains that it intends to keep short term rates either
at zero or nominal levels for an extended period of time, and the
CPI, although having risen from its cyclical low since the economy
started to recover, remains below the all time peak level set in
mid-2008.
The 30 yr Treasury yield did rise sharply from exceptionally
depressed levels at the end of 2008 with the uptrend continuing
right on into April, 2010. The market responded to the development
of economic recovery and sharp rises in all the cyclical pressure
gauges, with the yield running up to 4.8%.
The yield has fallen sharply since then as the leading economic
indicators have weakened and the cycle pressure gauges have eased.
Moreover, the market is now anticipating further weakness in the
economy and a likely continuing deceleration of inflation pressure.
In fact, bond market players may now be expecting that the CPI
could again go negative yr/yr on a further slowdown of the
economy.
The Treasury is overbought on technical and fundamental grounds
but the rally action is not irrational as the market is discounting
further economic weakness and is growing more confident that the
economy is near to leveling off or worse.
The trick, if you are invested in or are long the bond market on a
trade, is to realize that the market can turn on a dime if data
pointing to a fresh bounce in the economy are reported. Not only
that, but yields can run up very quickly if players perceive a
change in economic momentum to the positive. You need to pay
even closer attention now, because the Treasury market has
started to run ahead of the fundamentals, however muted they
presently are.
There has been much talk again recently about whether the
Treasury market is a bubble market. I do not find such discussions
to be useful. To be a bear on Treasuries translates into expecting
economic growth that will bring increased inflation and eventual
higher short term interest rates that will trigger substantially
higher bond yields. For that we need to see signs that the
economy is set to experience a re-acceleration of growth.
30 yr Treasury yield chart.
Wednesday, August 18, 2010
Stock Market & Financial Liquidity
I downgraded this type of work over 2001 - 02, when massive
excess liquidity gave a false buy signal for stocks. But the work
can still be effective, so I keep up on it and use it as a secondary
indicator.
Measured yr/yr, the $ value of industrial production reached
its strongest % change numbers in recent months since the mid-
1990s. Compared against my broad measure of credit driven
financial liquidity, it surged, leading to a large increase in money
velocity and a consequent sharp drop of liquidity. That sort of
development is usually a negative for stocks as the real economy
draws available liquidity away from the stock market. We did see
a roughly comparable situation to the present in 1994 -1995
when strong production growth far exceeded broad financial
liquidity growth. Interestingly, the liquidity situation improved
substantially over 1995 as the momentum of production growth
eased and financial liquidity growth accelerated. This development
helped much to underwrite a strong stock market from late 1994
through mid-1998.
To see a similar development over the next 12 months, we might
look for the yr/yr growth of the $value of production to moderate to
a more sustainable but positive level and also see a marked
acceleration of private sector credit and funding growth. This
re-balancing would signify that recovery is on a more sensible
path and it would sharply reduce the liquidity deficit headwind the
stock market is now encountering. So far, however, we have yet
to see the private sector "loosen up" to conduct commerce with
more credit usage.
The foregoing might strike some readers as mere fancy footwork,
but that would be to miss an important point: Over time, the stock
market does compete with the real economy for liquidity.
excess liquidity gave a false buy signal for stocks. But the work
can still be effective, so I keep up on it and use it as a secondary
indicator.
Measured yr/yr, the $ value of industrial production reached
its strongest % change numbers in recent months since the mid-
1990s. Compared against my broad measure of credit driven
financial liquidity, it surged, leading to a large increase in money
velocity and a consequent sharp drop of liquidity. That sort of
development is usually a negative for stocks as the real economy
draws available liquidity away from the stock market. We did see
a roughly comparable situation to the present in 1994 -1995
when strong production growth far exceeded broad financial
liquidity growth. Interestingly, the liquidity situation improved
substantially over 1995 as the momentum of production growth
eased and financial liquidity growth accelerated. This development
helped much to underwrite a strong stock market from late 1994
through mid-1998.
To see a similar development over the next 12 months, we might
look for the yr/yr growth of the $value of production to moderate to
a more sustainable but positive level and also see a marked
acceleration of private sector credit and funding growth. This
re-balancing would signify that recovery is on a more sensible
path and it would sharply reduce the liquidity deficit headwind the
stock market is now encountering. So far, however, we have yet
to see the private sector "loosen up" to conduct commerce with
more credit usage.
The foregoing might strike some readers as mere fancy footwork,
but that would be to miss an important point: Over time, the stock
market does compete with the real economy for liquidity.
Monday, August 16, 2010
Financial Liquidity & Banking System
Narrow and broad measures of money and credit driven liquidity
remain inadequate to fund continuing economic recovery if the
tighter liquidity situation persists through 2010. That is my
current "guesstimate". We are not experiencing a conventional
cyclical liquidity squeeze with fast rising short term interest rates
and overheated credit demand. Rather, we have a liquidity "freeze"
as the Fed presumably waits to see whether higher economic
demand will trigger a resumption of private sector credit demand
growth and an upturn of lending to qualified borrowers. the Fed is
jawboning the banks to lend to businesses with rising order books
and solid cash flows. If lenders and borrowers remain unresponsive
to super low interest rates, the next monetary step would be to
resume quantitative easing to support a shallow "cash and carry"
economy.
Now, monetary and the broader measure of credit driven liquidity
have both been expanding in recent weeks. Even the monetary base
has inched up. Moreover, the downtrends in private sector credit
demand -- business and households -- has eased very substantially.
All to the good, but not enough to signal sustainable positive change.
Banks have restored liquidity and are witnessing a decent recovery
of capital. They are also issuing a little more commercial paper and
are offering more large or jumbo time deposits (mostly reserve free).
The system is still carrying a massive loan loss reserve although it
has started to drift down. But, a number of banks have to be
positioned to lend moderately to high quality borrowers, including
households.
At this stage, the tighter liquidity position of the system is probably
forcing a number of investors to make asset allocation decisions with
more limited reserves and to be tempted to follow relative strength
among asset classes even more closely. Retail money market funds
are at their lowest levels since 2006, and institutional funds have
been heavily drawn down to the tune of 25%. The latter marks a
large reversal for a business with strong underlying growth.
remain inadequate to fund continuing economic recovery if the
tighter liquidity situation persists through 2010. That is my
current "guesstimate". We are not experiencing a conventional
cyclical liquidity squeeze with fast rising short term interest rates
and overheated credit demand. Rather, we have a liquidity "freeze"
as the Fed presumably waits to see whether higher economic
demand will trigger a resumption of private sector credit demand
growth and an upturn of lending to qualified borrowers. the Fed is
jawboning the banks to lend to businesses with rising order books
and solid cash flows. If lenders and borrowers remain unresponsive
to super low interest rates, the next monetary step would be to
resume quantitative easing to support a shallow "cash and carry"
economy.
Now, monetary and the broader measure of credit driven liquidity
have both been expanding in recent weeks. Even the monetary base
has inched up. Moreover, the downtrends in private sector credit
demand -- business and households -- has eased very substantially.
All to the good, but not enough to signal sustainable positive change.
Banks have restored liquidity and are witnessing a decent recovery
of capital. They are also issuing a little more commercial paper and
are offering more large or jumbo time deposits (mostly reserve free).
The system is still carrying a massive loan loss reserve although it
has started to drift down. But, a number of banks have to be
positioned to lend moderately to high quality borrowers, including
households.
At this stage, the tighter liquidity position of the system is probably
forcing a number of investors to make asset allocation decisions with
more limited reserves and to be tempted to follow relative strength
among asset classes even more closely. Retail money market funds
are at their lowest levels since 2006, and institutional funds have
been heavily drawn down to the tune of 25%. The latter marks a
large reversal for a business with strong underlying growth.
Wednesday, August 11, 2010
Stock Market -- Short Term Technical
Nasty doings, today. The SP 500 could not take out resistance levels
above 1120 during this recent rally. The market started to break
yesterday and blew out today with stern short term warnings. The
uptrend line off the the early July lows was broken and the standard
MACD format turned down. In addition, the "500" blew through
supportive 10 and 25 day moving averages.
The market dropped to a slightly oversold condition and a break
below 1070 -1075 on the "500" over the next 3-6 trading days would
pretty much scuttle an extension of the rally as momentum would
be unusually low to expect continuation.
SP 500 chart.
above 1120 during this recent rally. The market started to break
yesterday and blew out today with stern short term warnings. The
uptrend line off the the early July lows was broken and the standard
MACD format turned down. In addition, the "500" blew through
supportive 10 and 25 day moving averages.
The market dropped to a slightly oversold condition and a break
below 1070 -1075 on the "500" over the next 3-6 trading days would
pretty much scuttle an extension of the rally as momentum would
be unusually low to expect continuation.
SP 500 chart.
Monetary Policy -- Postscript
Today's sharp stock market sell off on the heels of yesterday's sloppy
close clearly suggests plenty of players were expecting the Fed step
up and announce further quantitative easing that would augment its
balance sheet.
The indicators I use to track Fed interest rate policy still stand 50%
in favor of a boost to the Fed Funds rate. The laggards remain a
very weak short term business credit supply / demand pressure
gauge and a still depressed capacity utilization rate. The Fed
certainly continues to figure that with a large gap between
production capacity and output, there should be little inflation
potential. The indicators are not about to signal higher rates until
such time as production re-accelerates and commercial loan demand
recovers.
One interesting possibility to consider is whether the Fed would
entertain a normal seasonal addition to reserves for the upcoming
holiday season. With a slowing economy, and important November
elections ahead, the FOMC could, if it wishes, elect to add reserves
temporarily to the system starting in September and do so without
fanfare. Just a thought, but it could be a nice little tonic.
close clearly suggests plenty of players were expecting the Fed step
up and announce further quantitative easing that would augment its
balance sheet.
The indicators I use to track Fed interest rate policy still stand 50%
in favor of a boost to the Fed Funds rate. The laggards remain a
very weak short term business credit supply / demand pressure
gauge and a still depressed capacity utilization rate. The Fed
certainly continues to figure that with a large gap between
production capacity and output, there should be little inflation
potential. The indicators are not about to signal higher rates until
such time as production re-accelerates and commercial loan demand
recovers.
One interesting possibility to consider is whether the Fed would
entertain a normal seasonal addition to reserves for the upcoming
holiday season. With a slowing economy, and important November
elections ahead, the FOMC could, if it wishes, elect to add reserves
temporarily to the system starting in September and do so without
fanfare. Just a thought, but it could be a nice little tonic.
Tuesday, August 10, 2010
Monetary Policy -- Fed Sits On Its Hands
Policy remains unchanged with the exception that the Fed will
prevent the automatic shrinkage of its balance sheet by rolling
over maturing mortgage backed securities into Treasuries. The
shrinkage that occured since this past spring coincided with a
slowing of the economic recovery and left them chagrined and
surprised so they telegraphed their fresh intent ahead of time.
But the bigger issue -- slowing monetary liquidity growth and no
private sector credit growth is unresolved. This pattern, if not
favorably settled within the markets themselves, is a prescription
for serious economic trouble. The Fed is in observer mode now and
later this month will get an earful from a range of economists who
attend the KC Fed's annual economics shindig at Jackson Hole, WY.
The Fed's prior 2009 - early 2010 massive quantitative easing
was a major and calculated step to unlock monetary and credit based
liquidity and harkened back to the massive liquidity infusions used
to generate economic recovery at the bottom of the Great Depression
in 1932. So, the recent easing of policy represents an extraordinary
step by the Fed and they probably prefer not to do more monetary
easing unless they feel compelled by economic reality and political
pressure.
There are a few indications that the shrinkage of private sector
borrowing may have wound down and that banks, who have been
adding jumbo deposits in recent weeks, could be preparing to step
up lending. But, this is entirely preliminary and could be reversed.
Sometimes the Fed has critical knowledge ahead of the markets and
sometimes they seem to lag the outside world and struggle to catch
up. For now, players will debate the problem and its possible
remedies, but the uncertainty will linger on.
prevent the automatic shrinkage of its balance sheet by rolling
over maturing mortgage backed securities into Treasuries. The
shrinkage that occured since this past spring coincided with a
slowing of the economic recovery and left them chagrined and
surprised so they telegraphed their fresh intent ahead of time.
But the bigger issue -- slowing monetary liquidity growth and no
private sector credit growth is unresolved. This pattern, if not
favorably settled within the markets themselves, is a prescription
for serious economic trouble. The Fed is in observer mode now and
later this month will get an earful from a range of economists who
attend the KC Fed's annual economics shindig at Jackson Hole, WY.
The Fed's prior 2009 - early 2010 massive quantitative easing
was a major and calculated step to unlock monetary and credit based
liquidity and harkened back to the massive liquidity infusions used
to generate economic recovery at the bottom of the Great Depression
in 1932. So, the recent easing of policy represents an extraordinary
step by the Fed and they probably prefer not to do more monetary
easing unless they feel compelled by economic reality and political
pressure.
There are a few indications that the shrinkage of private sector
borrowing may have wound down and that banks, who have been
adding jumbo deposits in recent weeks, could be preparing to step
up lending. But, this is entirely preliminary and could be reversed.
Sometimes the Fed has critical knowledge ahead of the markets and
sometimes they seem to lag the outside world and struggle to catch
up. For now, players will debate the problem and its possible
remedies, but the uncertainty will linger on.
Sunday, August 08, 2010
US Employment Situation
Private sector employment growth in the US has been in a trend
decline for a number of years now. And, when you factor out one
strong sector -- health care jobs -- the trend looks even worse.
Main factors behind the decline are: slower labor force growth,
jobs outsourcing abroad, growth in market share for imported
goods and services, and more recently, a slowing of foreign, jobs
creating business investment in the US reflecting a weaker dollar
over the past decade. In keeping with the down trend of jobs
growth, the US has also experienced a deceleration of growth in
real consumption as well, with the latter also reflecting demographic
change, too.
The very deep recession we experienced recently produced the
largest % decline in jobs measured yr/yr in many years. The
reversal in momentum from deep downtrend has been faster than
in recent recessions, but not nearly as quick as in the early post
WW2 decades.
As you will spot in viewing the chart linked to below, a positive
change in the growth of employment of more than 2% when
measured yr/yr, would be a significant achievement during this
economic recovery (chart).
Now, the longer term trend of the momentum of employment
growth suggests clearly that it could take an extended period of
time to bring the unemployed back into the fold if the factors
which underlie the trend remain in force. The issue is made the
worse by the fact that the US safety net programs have a short
term focus and work on the assumption that folks who lose their
jobs will be rapidly re-absorbed in to the ranks of the employed
as the recovery progresses.
There is talk about "structural" i.e. long term joblessness going
forward and that policies may need to be adopted to ameliorate
the problem. For my part, I would like to see how the economy
progresses over the next year or so before moving into that
activist camp because I think we need to see if companies are
going to continue to hold back on hiring as order backlogs reach
a larger scale.
decline for a number of years now. And, when you factor out one
strong sector -- health care jobs -- the trend looks even worse.
Main factors behind the decline are: slower labor force growth,
jobs outsourcing abroad, growth in market share for imported
goods and services, and more recently, a slowing of foreign, jobs
creating business investment in the US reflecting a weaker dollar
over the past decade. In keeping with the down trend of jobs
growth, the US has also experienced a deceleration of growth in
real consumption as well, with the latter also reflecting demographic
change, too.
The very deep recession we experienced recently produced the
largest % decline in jobs measured yr/yr in many years. The
reversal in momentum from deep downtrend has been faster than
in recent recessions, but not nearly as quick as in the early post
WW2 decades.
As you will spot in viewing the chart linked to below, a positive
change in the growth of employment of more than 2% when
measured yr/yr, would be a significant achievement during this
economic recovery (chart).
Now, the longer term trend of the momentum of employment
growth suggests clearly that it could take an extended period of
time to bring the unemployed back into the fold if the factors
which underlie the trend remain in force. The issue is made the
worse by the fact that the US safety net programs have a short
term focus and work on the assumption that folks who lose their
jobs will be rapidly re-absorbed in to the ranks of the employed
as the recovery progresses.
There is talk about "structural" i.e. long term joblessness going
forward and that policies may need to be adopted to ameliorate
the problem. For my part, I would like to see how the economy
progresses over the next year or so before moving into that
activist camp because I think we need to see if companies are
going to continue to hold back on hiring as order backlogs reach
a larger scale.
Friday, August 06, 2010
Economic Indicator Summary
Business sector growth moderated in recent months, but it sustained
a solid expansion through July.
I use four sets of leading economic indicators. They all point to a
further slowing of economic growth ahead but are not in all
sufficiently weak to signal an economic downturn of consequence.
Some of the indicators have been unusually volatile owing to marked
swings in sensitive materials prices which experience seasonal
weakness during mid year.
My long term indicators are positive but are eroding as a result of
a substantial loss of growth momentum of monetary liquidity
measures. Normally, this would not be a worry in the earlier stage
of an economic recovery because it is then when private sector credit
growth begins to accelerate. The latter has yet to occur, so the
economy has to be seen as at increasing risk down the road until
there is more money / credit in play. I am more quizzical than bearish
or bullish about the liquidity issue at this point.
I also wanted to mention my economic power index, which
measures the yr/yr % change of the real wage plus civilian jobs.
+4.0% would be a good vibrant number for this index. It is now
at +0.4%, indicating only rather modest purchasing power for the
large household sector.
Revised data show the consumer to be even more eager to rebuild
liquid savings to go along with a reluctance to take on more debt.
Companies are very leery to hire and are squeezing the hell out of
the work force for every last nickel of profit margin. The banks are
tightfisted. So we are moving from a spendthrift economy to a
tightwad economy and the US needs to regain balance quickly before
it moves more fully from one mode of dysfunction to another with
potentially disastrous results.
The US economy one year into recovery is operating well below
prior peak when critical categories such as retail sales, production
and capacity utilization, construction and employment are considered.
This has all followed a frightening economic free fall experienced
over Half 2 '08 and early 2009. There has been genuine financial
impairment, a loss of confidence and a sizable further loss of trust in
governmental authorities. But, folks need to accept risk to move the
economy toward better balance despite the disappointments of
the past several years.
I am cheering hard for a return to more balanced growth, but my
money is now resting on the sidelines (See prior post).
a solid expansion through July.
I use four sets of leading economic indicators. They all point to a
further slowing of economic growth ahead but are not in all
sufficiently weak to signal an economic downturn of consequence.
Some of the indicators have been unusually volatile owing to marked
swings in sensitive materials prices which experience seasonal
weakness during mid year.
My long term indicators are positive but are eroding as a result of
a substantial loss of growth momentum of monetary liquidity
measures. Normally, this would not be a worry in the earlier stage
of an economic recovery because it is then when private sector credit
growth begins to accelerate. The latter has yet to occur, so the
economy has to be seen as at increasing risk down the road until
there is more money / credit in play. I am more quizzical than bearish
or bullish about the liquidity issue at this point.
I also wanted to mention my economic power index, which
measures the yr/yr % change of the real wage plus civilian jobs.
+4.0% would be a good vibrant number for this index. It is now
at +0.4%, indicating only rather modest purchasing power for the
large household sector.
Revised data show the consumer to be even more eager to rebuild
liquid savings to go along with a reluctance to take on more debt.
Companies are very leery to hire and are squeezing the hell out of
the work force for every last nickel of profit margin. The banks are
tightfisted. So we are moving from a spendthrift economy to a
tightwad economy and the US needs to regain balance quickly before
it moves more fully from one mode of dysfunction to another with
potentially disastrous results.
The US economy one year into recovery is operating well below
prior peak when critical categories such as retail sales, production
and capacity utilization, construction and employment are considered.
This has all followed a frightening economic free fall experienced
over Half 2 '08 and early 2009. There has been genuine financial
impairment, a loss of confidence and a sizable further loss of trust in
governmental authorities. But, folks need to accept risk to move the
economy toward better balance despite the disappointments of
the past several years.
I am cheering hard for a return to more balanced growth, but my
money is now resting on the sidelines (See prior post).
Stock Market -- Back On The Sidelines
I seldom get chased out of long positions, but I did clear out my longs
(stocks + calls) yesterday and this morning. As mentioned back on
06/30, I took long positions with a scheduled six month time slot
with the SP 500 around 1018 - 1023. I sold out same with the SP
500 at 1115 - 1127. I operate with substantial leverage, but the
unlevered result was nearly +10%.
There was emotion in the sale. Not fear, not greed, but another
pressure -- aggravation. There was intellectual content to the
decision as well -- namely ignorance. The monetary and
credit liquidity indicators that command a strong position in my
thinking about the economy and the markets have so little
momentum that I simply cannot tell whether there will be enough
improvement to sustain economic recovery, much less the stock
market. As I see it, the Fed's decision to pull $200 bil. or 5%
out of the monetary base during the late spring looks like a mistake
as this bit of tightening leaves the liquidity situation precarious.
It is also interesting that the market tumbled shortly after that
little experiment in liquidity control and left Bernanke having to
say that the Fed can re-liquify as needed. Well, right now, it
looks like it might be needed.
So, I am back to short term time horizon trading of stocks and away
from longer time duration positions until it appears to me that
the Fed/ private sector are working to allow money and credit
sufficient to fund a more normal economic recovery as opposed to
the cliffhanger affair we have fallen prey to.
The tip off for me came after lunch yesterday when I found myself
hoping we would see a better employment picture today. As French
philosopher Albert Camus maintained : To hope is to despair. And,
friends, hope has its place in your lives, but not when it comes to the
markets and your money.
(stocks + calls) yesterday and this morning. As mentioned back on
06/30, I took long positions with a scheduled six month time slot
with the SP 500 around 1018 - 1023. I sold out same with the SP
500 at 1115 - 1127. I operate with substantial leverage, but the
unlevered result was nearly +10%.
There was emotion in the sale. Not fear, not greed, but another
pressure -- aggravation. There was intellectual content to the
decision as well -- namely ignorance. The monetary and
credit liquidity indicators that command a strong position in my
thinking about the economy and the markets have so little
momentum that I simply cannot tell whether there will be enough
improvement to sustain economic recovery, much less the stock
market. As I see it, the Fed's decision to pull $200 bil. or 5%
out of the monetary base during the late spring looks like a mistake
as this bit of tightening leaves the liquidity situation precarious.
It is also interesting that the market tumbled shortly after that
little experiment in liquidity control and left Bernanke having to
say that the Fed can re-liquify as needed. Well, right now, it
looks like it might be needed.
So, I am back to short term time horizon trading of stocks and away
from longer time duration positions until it appears to me that
the Fed/ private sector are working to allow money and credit
sufficient to fund a more normal economic recovery as opposed to
the cliffhanger affair we have fallen prey to.
The tip off for me came after lunch yesterday when I found myself
hoping we would see a better employment picture today. As French
philosopher Albert Camus maintained : To hope is to despair. And,
friends, hope has its place in your lives, but not when it comes to the
markets and your money.
Tuesday, August 03, 2010
Oil Price -- Leaving It To The Chasers
In a post back on May 14, I argued that the oil price had experienced
weakness that went beyond the usual late spring - early summer
seasonal dip and that oil in the $71 or less a bl. area might present
a nice go long opportunity to capitalize on a positive seasonal swing
later in the summer and hedge against rising gasoline and fuel prices
should they eventuate. This hedging opportunity worked out well
and with oil now moving to a short term overbought condition for the
first time since April, I am closing out my long contract with a tidy
profit and will hope that another trading opportunity arises soon.
Oil price.
weakness that went beyond the usual late spring - early summer
seasonal dip and that oil in the $71 or less a bl. area might present
a nice go long opportunity to capitalize on a positive seasonal swing
later in the summer and hedge against rising gasoline and fuel prices
should they eventuate. This hedging opportunity worked out well
and with oil now moving to a short term overbought condition for the
first time since April, I am closing out my long contract with a tidy
profit and will hope that another trading opportunity arises soon.
Oil price.
Monday, August 02, 2010
Stock Market --Technical
The rally which began at the turn of July is now into August. With 10
and 25 day m/avs moving up and the market holding above both,
there is reasonable confirmation of a short-intermediate term run.
The rally has been anything but smooth, with clear back and fill
that has allowed interested traders to reload. The market is getting
more heavily overbought short term, but it has so far weathered
prior quick overboughts during this run reasonably well.
The market has moved up to challenge intra-day resistance, and
since it is getting more overbought, there should be a challenge in
the days ahead. If the market motors through, then there is
another more formidable challenge up at 1130-35 on the SPX (1126
close today).
Since I thought the Apr. through Jun. sell off was a classic correction
I am working on the assumption that this rally is the initial phase
of an up-move that can run on into early 2011. I would also say
that this is clearly the minority view. Many traders see the rally
as a summer seasonal affair and some are saying it's just a
sucker rally. On top of this, the pundits will be out soon to warn
of the potential for a "hells bells" sell-off over Sept. - Oct.,
citing the many sell- offs that have occurred over the course of
history during the late summer - early autumn time slot. So, I
would imagine there are a reasonable number of players who plan
to show the current rally little respect.
SPX chart.
and 25 day m/avs moving up and the market holding above both,
there is reasonable confirmation of a short-intermediate term run.
The rally has been anything but smooth, with clear back and fill
that has allowed interested traders to reload. The market is getting
more heavily overbought short term, but it has so far weathered
prior quick overboughts during this run reasonably well.
The market has moved up to challenge intra-day resistance, and
since it is getting more overbought, there should be a challenge in
the days ahead. If the market motors through, then there is
another more formidable challenge up at 1130-35 on the SPX (1126
close today).
Since I thought the Apr. through Jun. sell off was a classic correction
I am working on the assumption that this rally is the initial phase
of an up-move that can run on into early 2011. I would also say
that this is clearly the minority view. Many traders see the rally
as a summer seasonal affair and some are saying it's just a
sucker rally. On top of this, the pundits will be out soon to warn
of the potential for a "hells bells" sell-off over Sept. - Oct.,
citing the many sell- offs that have occurred over the course of
history during the late summer - early autumn time slot. So, I
would imagine there are a reasonable number of players who plan
to show the current rally little respect.
SPX chart.
Friday, July 30, 2010
Economic Analysis*
Measured yr/yr, real GDP increased by about 3.3% through Q2 '10.
Given that this 12 month period represents a full year of recovery,
this is a disappointing result. Partly, it reflects slower than expected
rebuilding of inventories in the wake of enormous inventory
liquidation during the recession. My coincident indicators -- real
wage change, total civilian employment, real retail sales and
industrial production -- were up 3.1% on a combined basis. One
factor that jumps out in looking at these indicators is how deeply
employment fell and also how the change in employment remains
negative still on a yr/yr basis. Safety net and stimulus programs
notwithstanding, the weak recovery of employment to date does
represent a serious loss of purchasing power in the economy.
The coincident indicators do not account for consumer savings
preference or for credit use. Consumers are rebuilding savings and
so far, credit use has been declining in the aggregate. So, collectively,
consumption has been on a cash and carry basis with occasional
dollops of funds squirreled into savings.
Real GDP when measured yr/yr should really be up between 5-6%
in the early stage of recovery and the shortfalls in consumer spending
and inventory re-investment are important factors behind the
lag in expected performance.
Long term, I peg real GDP growth potential for the US at 2.8% per
year. That is below the historic rate and reflects reduced
assumptions concerning labor force growth and labor participation
rates. It is far too early to reduce growth potential further, but it
is fair to acknowledge that the fist full year of recovery was a
disappointment. I can understand the fear and caution this
recession has created, particularly since it hit the work force,
household wealth, and the banking system so hard. For now, I am
trusting that continued recovery, however moderate, will allow
all major sectors to loosen up and behave with more confidence.
---------------------------------------------------------------
* I have many reservations about using GDP data, not the least
of which are the political ends it is used to serve. So I'll probably
only touch on it once a year or so.
Given that this 12 month period represents a full year of recovery,
this is a disappointing result. Partly, it reflects slower than expected
rebuilding of inventories in the wake of enormous inventory
liquidation during the recession. My coincident indicators -- real
wage change, total civilian employment, real retail sales and
industrial production -- were up 3.1% on a combined basis. One
factor that jumps out in looking at these indicators is how deeply
employment fell and also how the change in employment remains
negative still on a yr/yr basis. Safety net and stimulus programs
notwithstanding, the weak recovery of employment to date does
represent a serious loss of purchasing power in the economy.
The coincident indicators do not account for consumer savings
preference or for credit use. Consumers are rebuilding savings and
so far, credit use has been declining in the aggregate. So, collectively,
consumption has been on a cash and carry basis with occasional
dollops of funds squirreled into savings.
Real GDP when measured yr/yr should really be up between 5-6%
in the early stage of recovery and the shortfalls in consumer spending
and inventory re-investment are important factors behind the
lag in expected performance.
Long term, I peg real GDP growth potential for the US at 2.8% per
year. That is below the historic rate and reflects reduced
assumptions concerning labor force growth and labor participation
rates. It is far too early to reduce growth potential further, but it
is fair to acknowledge that the fist full year of recovery was a
disappointment. I can understand the fear and caution this
recession has created, particularly since it hit the work force,
household wealth, and the banking system so hard. For now, I am
trusting that continued recovery, however moderate, will allow
all major sectors to loosen up and behave with more confidence.
---------------------------------------------------------------
* I have many reservations about using GDP data, not the least
of which are the political ends it is used to serve. So I'll probably
only touch on it once a year or so.
Wednesday, July 28, 2010
Earnings & The Stock Market
The current cyclical recovery in corp. profits has been very powerful
so far. In history, it has only been matched by the massive jumps in
profits that occurred in the post WW1 economic recovery, the
surge off the Great Depression bottom in 1932, the immediate
post WW2 recovery and the great bounce after the 1937 recession.
The current surge in profits has exceeded most observers' initial
estimates by a country mile.
Grand surges in profits off depressed levels as recoveries begin can
last up to four years and fool more conservative expectations. It is
absolutely true that the exceptional earnings recovery over the past
year has been in part fueled by cost cutting, but yr/yr sales are up
about 9.5% by my count. The sales have provided the leverage
needed to produce the profit gains, and it is critical to note that
most companies have achieved recovering sales with just nominal
purchasing power. Plus, we can throw on about $200 bil. of loan
loss reserves that pared the total figure.
Let me stir the pot a little bit more. The bookend recessions of the
past decade have led to a large output gap between sales as booked
and sales that would have been booked under more normal trend
progress conditions. For SP 500 profits that "gap" is about $30 per
share or 42% of 12 months profits through July. History shows that
when a large output gap opens up in the wake of very poor economic
performance, only a portion of it is made back with the rest lost to
history. Even so, there is latent profits recovery of consequence in
store.
Most agree there is a slowdown of output growth ahead, and as I
discussed yesterday there is uncertainty over the likely progress of
liquidity growth needed to sustain economic recovery. When you
contrast this line of thought with the fact that profits have been
exploding upward, I think you will find a situation where without a
very sharp and extended slowdown in output growth, profits could
continue to run strong even if there is only a modest acceleration
in the growth of pricing power as economic recovery progresses.
And, you can see this tension playing out in the financial media.
Earnings are popping, but macro data suggests a slowdown ahead.
Now, even if profits growth goes ahead and moderates sharply, we
may well wind up with 12 month earning power for the Sp 500 at
decently high levels -- say $80 to 85 a share -- with much more
to come when the slowdown ends and the economy steps up some
in growth.
I guess if you pool today's post with yesterday's, what may shake out
is risk / uncertainty in the short run for stocks vs. the potential for
a big pay day if the economy regains moderate balance.
Ah, well, something to think about.
so far. In history, it has only been matched by the massive jumps in
profits that occurred in the post WW1 economic recovery, the
surge off the Great Depression bottom in 1932, the immediate
post WW2 recovery and the great bounce after the 1937 recession.
The current surge in profits has exceeded most observers' initial
estimates by a country mile.
Grand surges in profits off depressed levels as recoveries begin can
last up to four years and fool more conservative expectations. It is
absolutely true that the exceptional earnings recovery over the past
year has been in part fueled by cost cutting, but yr/yr sales are up
about 9.5% by my count. The sales have provided the leverage
needed to produce the profit gains, and it is critical to note that
most companies have achieved recovering sales with just nominal
purchasing power. Plus, we can throw on about $200 bil. of loan
loss reserves that pared the total figure.
Let me stir the pot a little bit more. The bookend recessions of the
past decade have led to a large output gap between sales as booked
and sales that would have been booked under more normal trend
progress conditions. For SP 500 profits that "gap" is about $30 per
share or 42% of 12 months profits through July. History shows that
when a large output gap opens up in the wake of very poor economic
performance, only a portion of it is made back with the rest lost to
history. Even so, there is latent profits recovery of consequence in
store.
Most agree there is a slowdown of output growth ahead, and as I
discussed yesterday there is uncertainty over the likely progress of
liquidity growth needed to sustain economic recovery. When you
contrast this line of thought with the fact that profits have been
exploding upward, I think you will find a situation where without a
very sharp and extended slowdown in output growth, profits could
continue to run strong even if there is only a modest acceleration
in the growth of pricing power as economic recovery progresses.
And, you can see this tension playing out in the financial media.
Earnings are popping, but macro data suggests a slowdown ahead.
Now, even if profits growth goes ahead and moderates sharply, we
may well wind up with 12 month earning power for the Sp 500 at
decently high levels -- say $80 to 85 a share -- with much more
to come when the slowdown ends and the economy steps up some
in growth.
I guess if you pool today's post with yesterday's, what may shake out
is risk / uncertainty in the short run for stocks vs. the potential for
a big pay day if the economy regains moderate balance.
Ah, well, something to think about.
Tuesday, July 27, 2010
Stock Market -- Fundamentals
The Window Of Uncertainty
Core fundamentals remain positive but do not exhibit the strength
seen throughout 2009. This indicator has only two settings --
positive and negative. When the core is positive, monetary policy
is relaxed, confidence is high or improving and interest rates, both
short and long are in cyclical low zones. The signal goes negative
when the Fed actively tightens credit via raising short rates and
draining reserves and bond yields begin to rise on a cyclical basis.
Negative core fundamentals do not imply an end to a cyclical bull
market, as credit growth usually supports rising output and profits.
But a negative signal suggests investors should either raise some
cash and/or trade in the shorter run, as the "easy money" has been
made.
The window of uncertainty we are now encountering involves an
interval of unknown duration in which reliance of the economy
switches from monetary liquidity growth to private sector credit
to sustain recovery / expansion. Usually, this transition is seamless
and occurs early in the recovery cycle. It has not happened yet,
and the uncertainty is poignant because the Fed, having loaded the
system with monetary liquidity in 2009, has stopped adding on the
assumption private sector credit demand would grow and take up
the slack. The latter has yet to occur. The Fed is jawboning banks to
lend and Bernanke has promised to take steps to add liquidity in
the interim if the recovery falters. But, if this interim period is
mishandled, we could have a situation wherein the recovery fails
and a cyclical bear market develops even though core fundamentals
are "positive".
Such a failure would be unprecedented and, I suspect, it is still too
early to tell if a failure is other than a remote possibility. But, my
indicators show that a seamless transition from monetary to credit
driven growth has yet to occur, so the unpleasant possibility of a
serious screw-up needs to be flagged.
Investors are aware of this particular uncertainty issue. And, over
May and June, when my weekly cyclical pressure gauge took a
tumble, the market reacted in a strongly negative way. The
weekly pressure gauge has leveled off, and investors no doubt are
heartened by strong Q 2 '10 profits results and the Fed's pledge to
address the liquidity issue as needed (See the 6/15 post for more on
the pressure gauge).
Indications that economic and profits growth are going to be easing
along with the uncertainty inherent in present monetary / credit
policy have led the market to trade at a significant discount to fair
value despite the recent strong advance off the 07/02 low. My
Market Tracker has fair value for the SP 500 at 1215 based on
estimated 12 mos. net per share through July. The discount stands
at 8.2% now, and was even an even larger 15.8% in early July. The
Tracker is a cyclical measure. On my long term model, the market is
now well priced under 1155 for holding periods beyond three years.
If you are kind enough to be reading along still, I can tell you the US
has not seen a situation quite like this for a good 100 years, if not
longer. It could all be wrapped up tidily and positively in a month or
so, or it could drag on, in which case the best and time honored
indicators would fail to signal correctly what to do and would leave
us to fly by the seats of our pants. I remain positive but watchful.
Core fundamentals remain positive but do not exhibit the strength
seen throughout 2009. This indicator has only two settings --
positive and negative. When the core is positive, monetary policy
is relaxed, confidence is high or improving and interest rates, both
short and long are in cyclical low zones. The signal goes negative
when the Fed actively tightens credit via raising short rates and
draining reserves and bond yields begin to rise on a cyclical basis.
Negative core fundamentals do not imply an end to a cyclical bull
market, as credit growth usually supports rising output and profits.
But a negative signal suggests investors should either raise some
cash and/or trade in the shorter run, as the "easy money" has been
made.
The window of uncertainty we are now encountering involves an
interval of unknown duration in which reliance of the economy
switches from monetary liquidity growth to private sector credit
to sustain recovery / expansion. Usually, this transition is seamless
and occurs early in the recovery cycle. It has not happened yet,
and the uncertainty is poignant because the Fed, having loaded the
system with monetary liquidity in 2009, has stopped adding on the
assumption private sector credit demand would grow and take up
the slack. The latter has yet to occur. The Fed is jawboning banks to
lend and Bernanke has promised to take steps to add liquidity in
the interim if the recovery falters. But, if this interim period is
mishandled, we could have a situation wherein the recovery fails
and a cyclical bear market develops even though core fundamentals
are "positive".
Such a failure would be unprecedented and, I suspect, it is still too
early to tell if a failure is other than a remote possibility. But, my
indicators show that a seamless transition from monetary to credit
driven growth has yet to occur, so the unpleasant possibility of a
serious screw-up needs to be flagged.
Investors are aware of this particular uncertainty issue. And, over
May and June, when my weekly cyclical pressure gauge took a
tumble, the market reacted in a strongly negative way. The
weekly pressure gauge has leveled off, and investors no doubt are
heartened by strong Q 2 '10 profits results and the Fed's pledge to
address the liquidity issue as needed (See the 6/15 post for more on
the pressure gauge).
Indications that economic and profits growth are going to be easing
along with the uncertainty inherent in present monetary / credit
policy have led the market to trade at a significant discount to fair
value despite the recent strong advance off the 07/02 low. My
Market Tracker has fair value for the SP 500 at 1215 based on
estimated 12 mos. net per share through July. The discount stands
at 8.2% now, and was even an even larger 15.8% in early July. The
Tracker is a cyclical measure. On my long term model, the market is
now well priced under 1155 for holding periods beyond three years.
If you are kind enough to be reading along still, I can tell you the US
has not seen a situation quite like this for a good 100 years, if not
longer. It could all be wrapped up tidily and positively in a month or
so, or it could drag on, in which case the best and time honored
indicators would fail to signal correctly what to do and would leave
us to fly by the seats of our pants. I remain positive but watchful.
Friday, July 23, 2010
Long Treasury Bond
The first try at a sustainable cyclical run-up in yield started in Half 2
2009. It was aborted in recent months as cycle growth measures and
inflation pressures eased, thus postponing any move by the Fed to
tighten credit overtly via raising benchmark short rates. The recent
downdraft in the bond's yield conforms perfectly with my monthly
broad macro economic yield indicator(data through June). Now, the
weekly cyclical pressure gauges I follow have started to level out
after falling sharply over May and most of June. This suggests the
long Treasury yield may stabilize around 4.0% as players assess
whether the weekly data could be signaling that the economy is set
to show more stability (See chart which compares the $TYX with
GS's industrial metals index.)
The long guy's yield is well inside its 40 wk m/a. This indicates an
overbought condition. My long term technical and fundamental
indicators also suggest the bond is currently overbought. Trader
advisories are also moving into the "too bullish" camp.
Fed chair Bernanke says the economic outlook is "unusually
uncertain" right ahead, so it is doubtful the Fed is going to
get fired up to raise short rates soon. However, the bond market
can easily trade plus or minus 50 basis points as players read
the weekly economic tea leaves over July and August.
2009. It was aborted in recent months as cycle growth measures and
inflation pressures eased, thus postponing any move by the Fed to
tighten credit overtly via raising benchmark short rates. The recent
downdraft in the bond's yield conforms perfectly with my monthly
broad macro economic yield indicator(data through June). Now, the
weekly cyclical pressure gauges I follow have started to level out
after falling sharply over May and most of June. This suggests the
long Treasury yield may stabilize around 4.0% as players assess
whether the weekly data could be signaling that the economy is set
to show more stability (See chart which compares the $TYX with
GS's industrial metals index.)
The long guy's yield is well inside its 40 wk m/a. This indicates an
overbought condition. My long term technical and fundamental
indicators also suggest the bond is currently overbought. Trader
advisories are also moving into the "too bullish" camp.
Fed chair Bernanke says the economic outlook is "unusually
uncertain" right ahead, so it is doubtful the Fed is going to
get fired up to raise short rates soon. However, the bond market
can easily trade plus or minus 50 basis points as players read
the weekly economic tea leaves over July and August.
Thursday, July 22, 2010
Cyclicals -- Relative Strength Measure
Cyclicals have just barely matched the market this year, but
the relative strength line(RSL) for the group has been holding
support and does not yet indicate that investors are ready
to go along with the "double dip" economic scenario. For
that, I think we would need a sharp break down in the RSL
for the group. Chart
the relative strength line(RSL) for the group has been holding
support and does not yet indicate that investors are ready
to go along with the "double dip" economic scenario. For
that, I think we would need a sharp break down in the RSL
for the group. Chart
Economic Free Fall -- Some After Effects
First, A Little History
When the Great Depression kicked off in 1929, US industrial
output plunged, falling by nearly 53% until mid-1932. As 1932
commenced, the Fed finally began injecting liquidity heavily into
the system. By Half 2 1932, production started to rebound and
rose by 62% over the next 12 months. It was difficult to balance
supply and demand within the economy with such long range
volatility, and not surprisingly, production fell by 20% over Half 2
1933, before enough balance was restored to enable the economy
to begin to recover more smoothly.
Economic Free Fall: Mid 2008 - Early 2009
My best guess is that we had experienced a mini replay of the
Depression over the 2008-09 period. From its 06/08 peak of
350.0, my index of the $value of US production plunged 15.7% to
a cyclical low of 295.0 in 04/09, before it recovered 9.4% to 322.8
in 06/10. By, post WW2 standards, this action reflects phenomenal
volatility, and I suspect it has proven difficult for households,
businesses and banks to adjust to it. Thus, we see a recovery in
retail sales, along with the paydown/liquidation of consumer
debt and an effort to boost personal savings. We see businesses
re-tooling equipment but only very reluctantly hiring. And then,
there are the banks. They stuffed loans in your pockets in 2005-06,
but now they are reluctant to lend to top quality smaller credits.
Mentality Not On Fast Forward
The economy has moved ahead, but many folks have yet to catch
up with it. Economic free fall and an initial quick bounce happened
so fast that restoring and maintaining balance and perspective have
been difficult to accomplish.
Something Not So Nice Is Ahead
Since the end of April, the weekly leading economic indicator sets
I use have declined sharply. Both have stabilized a bit in July, but
the damage has been heavy enough to signal that an economic
slowdown of some meaningful proportion lies ahead. The ECRI
WLI*, now watched very closely by throngs, has experienced a
two month decline that is consistent with development of an
economic recession. This index went into free fall from mid-2008
until early 2009, and then experienced its fastest rebound ever.
In fact, it rose by more than it normally rises in the first two
years after a recession and the decline it has experienced since the
end of April brings it down to a level consistent with a 12-14 month
timeline of recovery from a substantial recession.
Most of the classical elements which presage a recession are not
in place. What we do have are confidence levels across the spectrum
that are so low, that if folks do "freeze up" -- do not spend, do not
lend and do not hire, we could be in the soup.
Now I follow a very simple maxim: The money gets spent in the
USA. The Fed has added prodigiously to the basic money supply.
"Pushing on a string" is not an American economic concept. I think
we move forward with recovery, but its resumption could await
restoration of more of a sense of balance among the players and a
boost to confidence, which incidentally, can turn on a dime.
Now, in the next couple of months, we need to see folks loosen up
a little and get with the program. Such does not mean return of
prodigality but a balanced response to a recovering environment.
...................................................................................................................
* ECRI website.
When the Great Depression kicked off in 1929, US industrial
output plunged, falling by nearly 53% until mid-1932. As 1932
commenced, the Fed finally began injecting liquidity heavily into
the system. By Half 2 1932, production started to rebound and
rose by 62% over the next 12 months. It was difficult to balance
supply and demand within the economy with such long range
volatility, and not surprisingly, production fell by 20% over Half 2
1933, before enough balance was restored to enable the economy
to begin to recover more smoothly.
Economic Free Fall: Mid 2008 - Early 2009
My best guess is that we had experienced a mini replay of the
Depression over the 2008-09 period. From its 06/08 peak of
350.0, my index of the $value of US production plunged 15.7% to
a cyclical low of 295.0 in 04/09, before it recovered 9.4% to 322.8
in 06/10. By, post WW2 standards, this action reflects phenomenal
volatility, and I suspect it has proven difficult for households,
businesses and banks to adjust to it. Thus, we see a recovery in
retail sales, along with the paydown/liquidation of consumer
debt and an effort to boost personal savings. We see businesses
re-tooling equipment but only very reluctantly hiring. And then,
there are the banks. They stuffed loans in your pockets in 2005-06,
but now they are reluctant to lend to top quality smaller credits.
Mentality Not On Fast Forward
The economy has moved ahead, but many folks have yet to catch
up with it. Economic free fall and an initial quick bounce happened
so fast that restoring and maintaining balance and perspective have
been difficult to accomplish.
Something Not So Nice Is Ahead
Since the end of April, the weekly leading economic indicator sets
I use have declined sharply. Both have stabilized a bit in July, but
the damage has been heavy enough to signal that an economic
slowdown of some meaningful proportion lies ahead. The ECRI
WLI*, now watched very closely by throngs, has experienced a
two month decline that is consistent with development of an
economic recession. This index went into free fall from mid-2008
until early 2009, and then experienced its fastest rebound ever.
In fact, it rose by more than it normally rises in the first two
years after a recession and the decline it has experienced since the
end of April brings it down to a level consistent with a 12-14 month
timeline of recovery from a substantial recession.
Most of the classical elements which presage a recession are not
in place. What we do have are confidence levels across the spectrum
that are so low, that if folks do "freeze up" -- do not spend, do not
lend and do not hire, we could be in the soup.
Now I follow a very simple maxim: The money gets spent in the
USA. The Fed has added prodigiously to the basic money supply.
"Pushing on a string" is not an American economic concept. I think
we move forward with recovery, but its resumption could await
restoration of more of a sense of balance among the players and a
boost to confidence, which incidentally, can turn on a dime.
Now, in the next couple of months, we need to see folks loosen up
a little and get with the program. Such does not mean return of
prodigality but a balanced response to a recovering environment.
...................................................................................................................
* ECRI website.
Monday, July 19, 2010
Gold -- Interesting Period Ahead
Back on 6/27, with gold at $1256 oz., I posted that the metal was
riskier in price on several measures, including the fact that my gold
macro-directional indicator had diverged negatively from the price of
gold. I mentioned $60 oz. of near term price risk. Well, we closed the
day at $1183. A considerable portion of the overbought has been
removed, but, as the linked -to chart below shows, we have two
month downtrends on RSI and MACD, and a wave theorist might
argue that gold has completed a five wave up move with a recent
top that was fatigued on a momentum basis.
The fun element here is that since gold began its latest uptrend in late
2008, the bugs have come in to buy all of the dips between 30 -40
on RSI. RSI on today's close is 40, so it will be interesting to see if
the bugs are set to launch a rescue effort and rally the stuff. A
significant break of trend, and gold is close to it, could be on the
nasty side if the gold buffs sit this one out.
Gold chart.
riskier in price on several measures, including the fact that my gold
macro-directional indicator had diverged negatively from the price of
gold. I mentioned $60 oz. of near term price risk. Well, we closed the
day at $1183. A considerable portion of the overbought has been
removed, but, as the linked -to chart below shows, we have two
month downtrends on RSI and MACD, and a wave theorist might
argue that gold has completed a five wave up move with a recent
top that was fatigued on a momentum basis.
The fun element here is that since gold began its latest uptrend in late
2008, the bugs have come in to buy all of the dips between 30 -40
on RSI. RSI on today's close is 40, so it will be interesting to see if
the bugs are set to launch a rescue effort and rally the stuff. A
significant break of trend, and gold is close to it, could be on the
nasty side if the gold buffs sit this one out.
Gold chart.
Friday, July 16, 2010
Inflation Situation
The CPI hit an all-time peak of 220.0 in 07/08. With recession in
full flower, it fell to an interim low of 210.2 in 12/08. The CPI has
recovered most of the decline since, but stands now at 218.0 for
June. Thus, technically, the US is still in deflation and more so
when you view asset deflation such as losses in home values and the
SP 500 over recent years.
From the interim low of 210.2 set 12/08, the CPI recovered by 3.7%
through 04/10, but has flattened out recently on weakness in the
commodities market and a continuing deceleration of the CPI
excluding food and fuels. The inflation pressure gauges I use did
peak over the Mar. / Apr. period and remain sluggish. My longer
term pressure gauge, which was signaling a sharp rise of inflation
in 2011, has moderated very substantially since the spring of 2010.
One key gauge of inflation potential, the capacity utilization rate,
stands at 74.1%, which is very low for the post WW2 period, and
is well below the the 80% level, when pricing pressures tend to pop.
Prospects for a moderation in the growth of China's manufacturing
output has put a chill on commodities prices, and is proving
beneficial to the US on the inflation front.
Measured yr/yr, the CPI was up by 1.1% through 06/10, and it
may well stay subdued until positive interest returns to the
commodities market. Commodities composites have bounced a bit in
recent weeks, but have yet to challenge a mild downtrend now in
place. CRB chart. When looking at inflation potential, you need to
watch commodities and oil in particular like a hawk.
The supply / demand equation for petroleum products and for
industrial commodities has tightened appreciably over the past
decade in comparison to the 1980s - 1990s. With Asia (ex. Japan)
and South America now sporting more vibrant economies, I have
developed a GDP weighted global total economic supply/ demand
pressure gauge. It has recovered substantially from its recession
low in early 2009, but at a current reading of 132.0 is well below
the 140 - 145 range that would suggest global inflation pressure
and an intense run-up in petroleum and industrial commodities
that could force sharp synchronous credit tightening by major
central banks. We are still in a "cool zone" now. One lesson from
the global gauge is that the US can experience cyclical inflation
pressure if the world is running hotter but the US is still running
well below effective capacity.
full flower, it fell to an interim low of 210.2 in 12/08. The CPI has
recovered most of the decline since, but stands now at 218.0 for
June. Thus, technically, the US is still in deflation and more so
when you view asset deflation such as losses in home values and the
SP 500 over recent years.
From the interim low of 210.2 set 12/08, the CPI recovered by 3.7%
through 04/10, but has flattened out recently on weakness in the
commodities market and a continuing deceleration of the CPI
excluding food and fuels. The inflation pressure gauges I use did
peak over the Mar. / Apr. period and remain sluggish. My longer
term pressure gauge, which was signaling a sharp rise of inflation
in 2011, has moderated very substantially since the spring of 2010.
One key gauge of inflation potential, the capacity utilization rate,
stands at 74.1%, which is very low for the post WW2 period, and
is well below the the 80% level, when pricing pressures tend to pop.
Prospects for a moderation in the growth of China's manufacturing
output has put a chill on commodities prices, and is proving
beneficial to the US on the inflation front.
Measured yr/yr, the CPI was up by 1.1% through 06/10, and it
may well stay subdued until positive interest returns to the
commodities market. Commodities composites have bounced a bit in
recent weeks, but have yet to challenge a mild downtrend now in
place. CRB chart. When looking at inflation potential, you need to
watch commodities and oil in particular like a hawk.
The supply / demand equation for petroleum products and for
industrial commodities has tightened appreciably over the past
decade in comparison to the 1980s - 1990s. With Asia (ex. Japan)
and South America now sporting more vibrant economies, I have
developed a GDP weighted global total economic supply/ demand
pressure gauge. It has recovered substantially from its recession
low in early 2009, but at a current reading of 132.0 is well below
the 140 - 145 range that would suggest global inflation pressure
and an intense run-up in petroleum and industrial commodities
that could force sharp synchronous credit tightening by major
central banks. We are still in a "cool zone" now. One lesson from
the global gauge is that the US can experience cyclical inflation
pressure if the world is running hotter but the US is still running
well below effective capacity.
Wednesday, July 14, 2010
Financial Liquidity & Banking System
Liquidity
There has been little change in my broad credit-driven measure of
financial liquidity in months. On balance, private sector credit
demand has remained lax, so banks have done little to create or
compete for the deposits that would touch off faster broad liquidity
growth. Interestingly, the Fed did ease along with monetary
liquidity in June, which it will need to continue to do if private sector
credit demand does not recover. The Fed is looking at its options in
this regard.
The Fed's outreach programs show that some bankers are reluctant
to lend to smaller businesses with strong cash flows because of
concern over collateral values and is indicating to banks that healthy
debt service capability should receive more priority. It is also clear
that even though FICO credit scores for households have slipped only
slightly over the past two years, banks are employing more stringent
standards in extending consumer credit. So, even though credit
demand has been modest in this economic recovery to date, it is
becoming more clear that bankers are also maintaining conservative
practices adopted in the immediate wake of the financial crisis. This is
a natural development given the grand magnitude of loan losses the
banks have piled up over the past two years, but at some point
before too long, they are going need to loosen up a little, especially
with regard to business credit.
Banking System
As is typical of recession / post recession periods, the banks have
been letting the total system loan / lease book run off. On a revised
basis the run off has been roughly $600 bil. or 6.2%. Even so, the
L&L book remains about $400 bil. over the long term trend as the
banks bring the book slowly into line with trend. By the same token,
banks have substantially increased their investment portfolios, and
my flash liquidity indicator (Treasuries vs. shorter term business
loans) has shown marked improvement. Bank capital has been
growing, and loan loss reserves have recently shown more stability.
It was also good to see that both consumer loans and commercial &
industrial loans showed stability in June, after lengthy declines. The
banks have a considerable way to go to get back into long term
balance, but there has been enough improvement to enable them to
participate in the economic recovery in a moderate way.
There has been little change in my broad credit-driven measure of
financial liquidity in months. On balance, private sector credit
demand has remained lax, so banks have done little to create or
compete for the deposits that would touch off faster broad liquidity
growth. Interestingly, the Fed did ease along with monetary
liquidity in June, which it will need to continue to do if private sector
credit demand does not recover. The Fed is looking at its options in
this regard.
The Fed's outreach programs show that some bankers are reluctant
to lend to smaller businesses with strong cash flows because of
concern over collateral values and is indicating to banks that healthy
debt service capability should receive more priority. It is also clear
that even though FICO credit scores for households have slipped only
slightly over the past two years, banks are employing more stringent
standards in extending consumer credit. So, even though credit
demand has been modest in this economic recovery to date, it is
becoming more clear that bankers are also maintaining conservative
practices adopted in the immediate wake of the financial crisis. This is
a natural development given the grand magnitude of loan losses the
banks have piled up over the past two years, but at some point
before too long, they are going need to loosen up a little, especially
with regard to business credit.
Banking System
As is typical of recession / post recession periods, the banks have
been letting the total system loan / lease book run off. On a revised
basis the run off has been roughly $600 bil. or 6.2%. Even so, the
L&L book remains about $400 bil. over the long term trend as the
banks bring the book slowly into line with trend. By the same token,
banks have substantially increased their investment portfolios, and
my flash liquidity indicator (Treasuries vs. shorter term business
loans) has shown marked improvement. Bank capital has been
growing, and loan loss reserves have recently shown more stability.
It was also good to see that both consumer loans and commercial &
industrial loans showed stability in June, after lengthy declines. The
banks have a considerable way to go to get back into long term
balance, but there has been enough improvement to enable them to
participate in the economic recovery in a moderate way.
Sunday, July 11, 2010
OEX 100 Put / Call Ratio
The OEX 100 (big caps) was an early entrant in the index option
derby and was probably one of the most popular for a number of
years. Normally, the OEX put / call ratio exceeds 1.00 as larger
players use puts to hedge long equity positions, either as a genaral
strategy or for OEX baskets held long. It is unusual to see the
put / call ratio below 1.00 because the players are then net long
and unhedged in total. Having traded OEX options for so many
years, I keep an eye on the P/C ratio if only for old time's sake.
The ratio went below 1.00 with some consistency toward the end
of 2008 and stayed low well into the early part of 2009. Partly,
this no doubt reflected the rising cost of options and the fact that
long OEX baskets had been sold out, but I also concluded the
bigger players believed the bear market was ending. We have a
similar situation today, and again, I have concluded that the bulk
of the corrective action may have been taken.
I also watch the OEX P/C ratio against the CBOE individual
equities P/C ratio. I have noticed that there are cases when the
OEX P/C is a whopping 1.5 and the CBOE is just .50. More
often than not, the OEX put buyers have been right and the
market is toppy. So too when the OEX is below 1.00 and the
CBOE is slightly elevated, say above .60. The market at these
times is more likely to be sold out.
This type of comparison does not work all the time, and it
requires a bit of a guess as to when to pay attention to it. But,
I have to say I am usually comfortable with comparisons of
this sort.
OEX put / call ratio chart. (Two looks).
derby and was probably one of the most popular for a number of
years. Normally, the OEX put / call ratio exceeds 1.00 as larger
players use puts to hedge long equity positions, either as a genaral
strategy or for OEX baskets held long. It is unusual to see the
put / call ratio below 1.00 because the players are then net long
and unhedged in total. Having traded OEX options for so many
years, I keep an eye on the P/C ratio if only for old time's sake.
The ratio went below 1.00 with some consistency toward the end
of 2008 and stayed low well into the early part of 2009. Partly,
this no doubt reflected the rising cost of options and the fact that
long OEX baskets had been sold out, but I also concluded the
bigger players believed the bear market was ending. We have a
similar situation today, and again, I have concluded that the bulk
of the corrective action may have been taken.
I also watch the OEX P/C ratio against the CBOE individual
equities P/C ratio. I have noticed that there are cases when the
OEX P/C is a whopping 1.5 and the CBOE is just .50. More
often than not, the OEX put buyers have been right and the
market is toppy. So too when the OEX is below 1.00 and the
CBOE is slightly elevated, say above .60. The market at these
times is more likely to be sold out.
This type of comparison does not work all the time, and it
requires a bit of a guess as to when to pay attention to it. But,
I have to say I am usually comfortable with comparisons of
this sort.
OEX put / call ratio chart. (Two looks).
Saturday, July 10, 2010
Stock Market --Technical
The SP 500 popped up enough last week to set up a challenge of the
downtrend in force over the past two months. For trend followers,
there is promise but no confirmation of a positive reversal, either
short or intermediate term. In fact, 13-14 wk indicators are still
negative.
We have had three legs down on this correction, so the challenge
of the downtrend line ahead may be more forceful. I must say,
however, that I very much dislike seeing a week end with a challenge
in view only to see it be postponed. That will prompt some trend line
traders to have reservations.
My NYSE buying pressure index has not broken down, and the
selling pressure index has failed to sustain a rise. When I look at
advances vs. declines on a rolling six wk. basis, there is net
accumulation underway, but there is nothing smooth about it. As
the chart link below shows, the cumulative NYSE adv / dec line
has held support well, has broken through its downtrend line and
is just turning positive on MACD. I am also heartened by the
dramatic improvement in the TRIN last week following an
extended interval of capitulation.
In short, the market is getting close, but has yet to earn the cigar
in the near term.
NYSE A /D chart.
downtrend in force over the past two months. For trend followers,
there is promise but no confirmation of a positive reversal, either
short or intermediate term. In fact, 13-14 wk indicators are still
negative.
We have had three legs down on this correction, so the challenge
of the downtrend line ahead may be more forceful. I must say,
however, that I very much dislike seeing a week end with a challenge
in view only to see it be postponed. That will prompt some trend line
traders to have reservations.
My NYSE buying pressure index has not broken down, and the
selling pressure index has failed to sustain a rise. When I look at
advances vs. declines on a rolling six wk. basis, there is net
accumulation underway, but there is nothing smooth about it. As
the chart link below shows, the cumulative NYSE adv / dec line
has held support well, has broken through its downtrend line and
is just turning positive on MACD. I am also heartened by the
dramatic improvement in the TRIN last week following an
extended interval of capitulation.
In short, the market is getting close, but has yet to earn the cigar
in the near term.
NYSE A /D chart.
Friday, July 09, 2010
Consumer Credit
Consumer credit -- excluding mortgages -- declined again May, and
it is down about 7% from the peak of nearly $2.6 tril. in 2008. This
no doubt reflects the severe decline and only partial recovery of
retail sales over the period, but It is also probably an outcome to be
expected given the extraordinary plummet in consumer confidence
as well. Confidence has recovered modestly over the past year, but
it is just coming up to the lows registered after prior economic
declines. Chart.
The chart does show an extended period of low confidence in the
early 1990s. Back then, the housing market was also weak, and there
was a surge in so-called white collar layoffs not seen before in the
post WW 2 era over the same interval. Noteworthy is that total
consumer credit was flat over most of the 1990 - 93 period before
recovering.
I am reluctant to say we have entered a "new normal" era of
consumer deleveraging or credit use austerity, as it seems that the
round of revolving credit paydown / default we have witnessed in
this cycle reflects the depth of the recession and the pounding
consumer confidence has taken -- weaker home prices, damaged
retirement savings, a depressed job market. I think it is too early
in the game to posit a new era of austerity and that we need to
first see how confidence responds to continued economic recovery.
it is down about 7% from the peak of nearly $2.6 tril. in 2008. This
no doubt reflects the severe decline and only partial recovery of
retail sales over the period, but It is also probably an outcome to be
expected given the extraordinary plummet in consumer confidence
as well. Confidence has recovered modestly over the past year, but
it is just coming up to the lows registered after prior economic
declines. Chart.
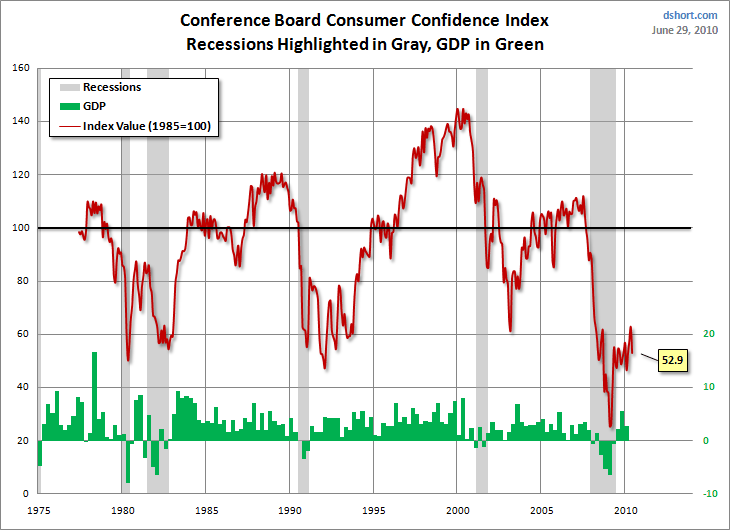
The chart does show an extended period of low confidence in the
early 1990s. Back then, the housing market was also weak, and there
was a surge in so-called white collar layoffs not seen before in the
post WW 2 era over the same interval. Noteworthy is that total
consumer credit was flat over most of the 1990 - 93 period before
recovering.
I am reluctant to say we have entered a "new normal" era of
consumer deleveraging or credit use austerity, as it seems that the
round of revolving credit paydown / default we have witnessed in
this cycle reflects the depth of the recession and the pounding
consumer confidence has taken -- weaker home prices, damaged
retirement savings, a depressed job market. I think it is too early
in the game to posit a new era of austerity and that we need to
first see how confidence responds to continued economic recovery.
Wednesday, July 07, 2010
Stock Market Psychology
The market has been doggedly following short term economic
factors, particularly the ECRI leading index, weekly unemployment
claims, sensitive materials prices and the 2 yr. Treas. note yield.
At first, I thought strength so far this week might reflect other
positive economic signs such as a large increase in global chip sales
and indications retail store sales were pretty decent in June. Then,
I checked in with "Dr. Copper", one of the better economic
forecasters around, only to find that the copper price has started to
edge up in recent days. Since copper is one of the more important
of the group of industrial commodities, action in this market may
be receiving unusually heavy scrutiny by stock traders. This would
also suggest that the market might still be retaining its narrow
short term focus on near-in fundamentals. Copper.
factors, particularly the ECRI leading index, weekly unemployment
claims, sensitive materials prices and the 2 yr. Treas. note yield.
At first, I thought strength so far this week might reflect other
positive economic signs such as a large increase in global chip sales
and indications retail store sales were pretty decent in June. Then,
I checked in with "Dr. Copper", one of the better economic
forecasters around, only to find that the copper price has started to
edge up in recent days. Since copper is one of the more important
of the group of industrial commodities, action in this market may
be receiving unusually heavy scrutiny by stock traders. This would
also suggest that the market might still be retaining its narrow
short term focus on near-in fundamentals. Copper.
Monday, July 05, 2010
Stock Market -- Technical
1) The market is moderately oversold on a price momentum basis
for the short term, and it is closing in on exhaustion of the sell-off.
NYSE breadth has held up better than has price momentum, and
the market is not oversold but is neutral on these measures. My
breadth indicators, when oversold, are more reliable than the
price momentum measures. The SP 500 closed out last week at
1023. Next support level is 1000.
2) My biggest technical concern during the nearly 13 month long
80% leg-up in the market off the 03/09 low was that the angle of
the trajectory was simply too steep and that at some point investors
would be faced with an extended consolidation / sell-off interval
before there could be another durable up-move. Much, but not all
of that risk, has been removed over the past couple of months.
3) For many years, I have used a price oscillator determined weekly
off the 40 wk m/a. Toward the end of 2009, that oscillator (the
premium / discount in price off the 40 wk m/a) reached extended
levels not seen since the bubble years of 1997 - 99. Now, the market
has swung to a discount steep enough to be consistent with a
developing bear market. The current reading is neutral between
whether a cyclical bear is in force or whether we face a steep price
correction in an ongoing cyclical bull (a kind of "economic slowdown
shock"). Since the volatility in the market (and in the economy) has
been so great over the past two years, I think it is simply premature
to call a cyclical bear, and I am remaining in the bull camp for now.
Strategy
As discussed last week, I am presently long the market. But, I
envision running a personal hedge fund primarily using options
to hedge my position in various ways until we see a diminution in
economic volatility which I freely concede might not occur until
another 12 months has gone bye the bye. (I have traded call and
put options since the mid-1970s. Such trading can be a vexing
and frustrating affair, particularly as regards order execution. I
enjoy it overall, but such trading is not for everyone. Practice first
for an extended period before you try for real.)
I have linked to a weekly chart for the SP 500 which suggests the
market may also be close to an exhaustion of the recent sell-off.
Chart.
for the short term, and it is closing in on exhaustion of the sell-off.
NYSE breadth has held up better than has price momentum, and
the market is not oversold but is neutral on these measures. My
breadth indicators, when oversold, are more reliable than the
price momentum measures. The SP 500 closed out last week at
1023. Next support level is 1000.
2) My biggest technical concern during the nearly 13 month long
80% leg-up in the market off the 03/09 low was that the angle of
the trajectory was simply too steep and that at some point investors
would be faced with an extended consolidation / sell-off interval
before there could be another durable up-move. Much, but not all
of that risk, has been removed over the past couple of months.
3) For many years, I have used a price oscillator determined weekly
off the 40 wk m/a. Toward the end of 2009, that oscillator (the
premium / discount in price off the 40 wk m/a) reached extended
levels not seen since the bubble years of 1997 - 99. Now, the market
has swung to a discount steep enough to be consistent with a
developing bear market. The current reading is neutral between
whether a cyclical bear is in force or whether we face a steep price
correction in an ongoing cyclical bull (a kind of "economic slowdown
shock"). Since the volatility in the market (and in the economy) has
been so great over the past two years, I think it is simply premature
to call a cyclical bear, and I am remaining in the bull camp for now.
Strategy
As discussed last week, I am presently long the market. But, I
envision running a personal hedge fund primarily using options
to hedge my position in various ways until we see a diminution in
economic volatility which I freely concede might not occur until
another 12 months has gone bye the bye. (I have traded call and
put options since the mid-1970s. Such trading can be a vexing
and frustrating affair, particularly as regards order execution. I
enjoy it overall, but such trading is not for everyone. Practice first
for an extended period before you try for real.)
I have linked to a weekly chart for the SP 500 which suggests the
market may also be close to an exhaustion of the recent sell-off.
Chart.
Friday, July 02, 2010
Economic & Profits Indicators
Weekly leading indicators have recently stabilized after a
sudden and wrenching downturn running through May and mid-
June. But there has been an unmistakable signal that slowing
of recovery progress lies ahead. Monthly leading indicators also
signal a slowdown, but have held up better than the weeklies. The
recovery surge in the monthly indicators from early 2009 was not
exceptional at all, while the lift off in the weeklies was the strongest
in the modern era. When the weeklies such as the ECRI set are
viewed in the context of the first 24 months of recovery, the recent
weakness brings them down to average from super-strong. the
weeklies in the US line up best with the powerful recovery of
export sales and factory orders and less so compared to the broader
economy.
My economic power index, which focuses on the real wage and
the change of total employment, has been slow to recover. The
real wage, measured yr/yr is flat. This reflects weak labor market
conditions, but it also continues a trend of business to not reward
labor for productivity improvement but to let rewards flow entirely
to capital instead. Investors applaud the practice on an individual
company level, but, when seen in the aggregate, it undermines the
purchasing power of the economy and leads to a reduction in the
efficiency of $ capital. The index results also show companies have
been slow to rehire, preferring to "milk" current operations as
fully as possible. The salutary here for workers is that real take
home pay is up 1.6% yr/yr entirely as a result of more hours
worked plus OT.
The slow recovery of the EPI coupled with wage earner attempts
to replenish savings and avoid dipping into credit has created an
environment that supports modest and not robust economic
progress.
Profits indicators were very strong through the first five
months of 2010, but they did moderate in June, and the leading
indicators now suggest further moderation as the year progresses.
My long term leading economic indicators were the
strongest ever at the end of 2008. The indicators have lost
strength since then but remain positive and continue to support
economic and profits recovery through 2011. However, I am
concerned that the Fed not be asleep at the switch and that It
will be prepared to provide additional monetary liquidity to the
system if private sector credit demand -- now basing -- does not
show decent lift by this year's end.
sudden and wrenching downturn running through May and mid-
June. But there has been an unmistakable signal that slowing
of recovery progress lies ahead. Monthly leading indicators also
signal a slowdown, but have held up better than the weeklies. The
recovery surge in the monthly indicators from early 2009 was not
exceptional at all, while the lift off in the weeklies was the strongest
in the modern era. When the weeklies such as the ECRI set are
viewed in the context of the first 24 months of recovery, the recent
weakness brings them down to average from super-strong. the
weeklies in the US line up best with the powerful recovery of
export sales and factory orders and less so compared to the broader
economy.
My economic power index, which focuses on the real wage and
the change of total employment, has been slow to recover. The
real wage, measured yr/yr is flat. This reflects weak labor market
conditions, but it also continues a trend of business to not reward
labor for productivity improvement but to let rewards flow entirely
to capital instead. Investors applaud the practice on an individual
company level, but, when seen in the aggregate, it undermines the
purchasing power of the economy and leads to a reduction in the
efficiency of $ capital. The index results also show companies have
been slow to rehire, preferring to "milk" current operations as
fully as possible. The salutary here for workers is that real take
home pay is up 1.6% yr/yr entirely as a result of more hours
worked plus OT.
The slow recovery of the EPI coupled with wage earner attempts
to replenish savings and avoid dipping into credit has created an
environment that supports modest and not robust economic
progress.
Profits indicators were very strong through the first five
months of 2010, but they did moderate in June, and the leading
indicators now suggest further moderation as the year progresses.
My long term leading economic indicators were the
strongest ever at the end of 2008. The indicators have lost
strength since then but remain positive and continue to support
economic and profits recovery through 2011. However, I am
concerned that the Fed not be asleep at the switch and that It
will be prepared to provide additional monetary liquidity to the
system if private sector credit demand -- now basing -- does not
show decent lift by this year's end.
Wednesday, June 30, 2010
Stock Market -- Going Long
Since I have not made a big mistake in a long time, I am entitled to
one. So, I am entering long stock market orders with a six month
time horizon and should complete by the end of this week. In my
view, the market is pricing in a cyclical downturn of earnings to
commence before the end of 2010. My indicators do not show that
and it will likely be a number of months before they would. I have
no argument with a slowdown or a back up of business inventories
for a few months. But, I think the economic recovery will persist.
The market is developing a deep oversold in the short run, and
with $80 of annual earning power in the cards for the SP 500
this year, stocks are reasonably priced currently. If the market
weakens further or churns about over the remainder of the
summer, I will write against my longs, book some income, and
lower my break evens. I will also do some very short term trades,
both long and short in equities and fixed income as well.
Since this is not a blog about my portfolio, I plan to return to
the more universal type of comment in upcoming posts.
one. So, I am entering long stock market orders with a six month
time horizon and should complete by the end of this week. In my
view, the market is pricing in a cyclical downturn of earnings to
commence before the end of 2010. My indicators do not show that
and it will likely be a number of months before they would. I have
no argument with a slowdown or a back up of business inventories
for a few months. But, I think the economic recovery will persist.
The market is developing a deep oversold in the short run, and
with $80 of annual earning power in the cards for the SP 500
this year, stocks are reasonably priced currently. If the market
weakens further or churns about over the remainder of the
summer, I will write against my longs, book some income, and
lower my break evens. I will also do some very short term trades,
both long and short in equities and fixed income as well.
Since this is not a blog about my portfolio, I plan to return to
the more universal type of comment in upcoming posts.
Tuesday, June 29, 2010
Long US Treasury -- Getting Overbought
Yes, the 30 yr. Treas. is getting overbought on its 40 wk m/a and on
12 wk RSI. The sentiment indicators I follow have moved well into
"too many bulls" territory as well. So, the bond is setting up as a
short on technical grounds, but given the strong price momentum,
I would like to see sentiment get more extreme. $USB chart.
Parenthetically, it is rather ironic to see this bond moving to a major
overbought when so many market pundits and observers had written
it off as done for earlier in the year.
12 wk RSI. The sentiment indicators I follow have moved well into
"too many bulls" territory as well. So, the bond is setting up as a
short on technical grounds, but given the strong price momentum,
I would like to see sentiment get more extreme. $USB chart.
Parenthetically, it is rather ironic to see this bond moving to a major
overbought when so many market pundits and observers had written
it off as done for earlier in the year.
Sunday, June 27, 2010
Gold Price
Technical
The gold price remains in a solid uptrend off its late 2008 low of
$700 oz. It is moderately overbought against the 40 wk m/a, but
is capable of a larger premium based on past experience. As the
chart shows, it is getting overbought on weekly RSI and MACD,
although trends of these measures are positive. $GOLD. I would
also suggest that at $1256, the gold price is getting extended on
the 5 year chart as well.
For the fun of it, I developed a little "Frothometer" for gold, and
it currently indicates a moderate level of froth and, it suggests that
matters get bubbly above $1300 oz. in the near term.
Fundamental
My gold macro-directional indicator had trended up reasonably
consistently since the latter part of 2008, but the advance did
break off at the end of 04/10, primarily reflecting weakness in
the industrial commodities and oil price parts of the indicator.
These components are stabilizing in the short run, but the gold
price has diverged positively from the full indicator to the tune
of about $60 oz. That represents a significant but not unprecedented
divergence.
Summary
There is growing near term price risk in gold, but the risk is not
yet at "screamer" levels. Folks interested in gold should take note.
I have linked to a chart (below) which shows the relative strength
of gold compared to the platinum price in recent years. Notice how
gold has started to outperform platinum in recent weeks. This
may suggest that interest in gold is presently more a consequence
of investor concern about global financial / economic stability.
Chart.
The gold price remains in a solid uptrend off its late 2008 low of
$700 oz. It is moderately overbought against the 40 wk m/a, but
is capable of a larger premium based on past experience. As the
chart shows, it is getting overbought on weekly RSI and MACD,
although trends of these measures are positive. $GOLD. I would
also suggest that at $1256, the gold price is getting extended on
the 5 year chart as well.
For the fun of it, I developed a little "Frothometer" for gold, and
it currently indicates a moderate level of froth and, it suggests that
matters get bubbly above $1300 oz. in the near term.
Fundamental
My gold macro-directional indicator had trended up reasonably
consistently since the latter part of 2008, but the advance did
break off at the end of 04/10, primarily reflecting weakness in
the industrial commodities and oil price parts of the indicator.
These components are stabilizing in the short run, but the gold
price has diverged positively from the full indicator to the tune
of about $60 oz. That represents a significant but not unprecedented
divergence.
Summary
There is growing near term price risk in gold, but the risk is not
yet at "screamer" levels. Folks interested in gold should take note.
I have linked to a chart (below) which shows the relative strength
of gold compared to the platinum price in recent years. Notice how
gold has started to outperform platinum in recent weeks. This
may suggest that interest in gold is presently more a consequence
of investor concern about global financial / economic stability.
Chart.
Friday, June 25, 2010
Stock Market -- Short Term Technical
As suggested in the 06/04 post on the market, there was a good
long side trade to be had the week starting 06/07. But it was a
very short term affair as I had to respect how quickly the profit
taking came in after the market reached a mild overbought on price.
That was certainly not an encouraging sign.
I am on the sidelines now and merely plan to watch whether a
decently tradeable short term trend will develop. It would not
surprise me if a period of price compression is on the way that could
last for a few weeks. If such happens, the eventual break from the
compression period will provide a better opportunity, although
price range narrowing rarely tips you off on which way the market
will break.
As of today, the market is trading about midway between a
level that would signal a positive break to the upside and another
decline to test the support zone (1050 on the SP 500). Take your
pick.
SP 500 chart.
long side trade to be had the week starting 06/07. But it was a
very short term affair as I had to respect how quickly the profit
taking came in after the market reached a mild overbought on price.
That was certainly not an encouraging sign.
I am on the sidelines now and merely plan to watch whether a
decently tradeable short term trend will develop. It would not
surprise me if a period of price compression is on the way that could
last for a few weeks. If such happens, the eventual break from the
compression period will provide a better opportunity, although
price range narrowing rarely tips you off on which way the market
will break.
As of today, the market is trading about midway between a
level that would signal a positive break to the upside and another
decline to test the support zone (1050 on the SP 500). Take your
pick.
SP 500 chart.
Wednesday, June 23, 2010
Monetary Policy
The Fed left rates unchanged today as everyone figured they would.
At present, the case for raising rates is 50% based on time tested
indicators of Fed behavior. The main issues in the way of hiking
rates concern the low rate of capacity utilization and the fact that
private sector shorter term credit demand has yet to turn up.
As an illustration of still low capacity utilization, consider USA steel
output. In mid-2008, output was running at 2,155K tons and the
industry operating rate topped 90%. When the economy went into
free fall later in the year, steel output fell to 990k tons by 04/09,
and cap. util. fell to 40%. Now, steel output is running 1,800K and
the operating rate is up to about 75%. More intense cost and pricing
pressures arise once the steel operating rate crosses 83% or so.
Since steel output appears to be moderating now, it will be a while
before price increases intensify again. Ditto, globally.
Both business short term credit demand and consumer credit (excl.
mortgages) fell sharply from mid-2008 through early 2010. Both
sectors are showing signs of stabilization in recent months, but no
upturns are in place.
The Fed bides its time until there is some indication of tighter
resource utilization and more sustainable inflationary pressure.
At present, the case for raising rates is 50% based on time tested
indicators of Fed behavior. The main issues in the way of hiking
rates concern the low rate of capacity utilization and the fact that
private sector shorter term credit demand has yet to turn up.
As an illustration of still low capacity utilization, consider USA steel
output. In mid-2008, output was running at 2,155K tons and the
industry operating rate topped 90%. When the economy went into
free fall later in the year, steel output fell to 990k tons by 04/09,
and cap. util. fell to 40%. Now, steel output is running 1,800K and
the operating rate is up to about 75%. More intense cost and pricing
pressures arise once the steel operating rate crosses 83% or so.
Since steel output appears to be moderating now, it will be a while
before price increases intensify again. Ditto, globally.
Both business short term credit demand and consumer credit (excl.
mortgages) fell sharply from mid-2008 through early 2010. Both
sectors are showing signs of stabilization in recent months, but no
upturns are in place.
The Fed bides its time until there is some indication of tighter
resource utilization and more sustainable inflationary pressure.
Monday, June 21, 2010
Energy Sector Relative Strength
The energy sector has badly underperformed the SP 500 since the
popping of the oil price bubble in 2008. Relative performance of
the energy sector has outrun the deep down trend line from 2008,
but, as is interesting, it is threatening to break out of a tight down
trend line dating back 12 months. The recent bounce in the oil price
and the apparent basing of the natural gas price are helping as is
the passing of the peak in merger arbitrage of the Exxon / XLO
deal. The broad group is doing ok despite hits to BP and Anadarko,
so a breakout above trend may be of interest. Chart.
popping of the oil price bubble in 2008. Relative performance of
the energy sector has outrun the deep down trend line from 2008,
but, as is interesting, it is threatening to break out of a tight down
trend line dating back 12 months. The recent bounce in the oil price
and the apparent basing of the natural gas price are helping as is
the passing of the peak in merger arbitrage of the Exxon / XLO
deal. The broad group is doing ok despite hits to BP and Anadarko,
so a breakout above trend may be of interest. Chart.
Friday, June 18, 2010
Economic Comment
Economic recovery in the US and globally has been mild, especially
when compared to the strong rebounds in the leading indicators,
factory orders, and the various weekly and monthly cyclical pressure
gauges I use. all these measures plunged after mid-2008 and did
rebound about as strongly through the end of April, this year. In
fact, my coincident indicators -- real wage and retail sales plus
industrial production and civilian employment -- are up but 3.2%
yr/yr through 4/10 and remain well below pre-recession peaks.
Not the strength here the leading indicators and pressure gauges
would suggest.
Given the mild recovery, the indicators should not have been so
strong. Interestingly, the BIG "V" of the indicators / gauges does
measure up very nicely with the behavior of the trade accounts
since mid - 2008. Total US trade (imports + exports) fell nearly
40% from mid- 2008 to the 4/09 trough, and has rebounded by
25% since. There is also a BIG "V" in US factory orders over the
same interval. Other major economies have also experienced
powerful swings in trade, but in all cases, exports are netted out
against imports in computing country GDPs so that the immense
swing in global trade is heavily muted when you view final
demand around the globe.
The rebound in US export sales since 4/09 has dwarfed the
recoveries in other major output categories. Thus one issue that
comes up is whether the recent weakness in the weekly pressure
gauges discussed in the Tues. post may reflect the start of
moderation in export sales. And when the recent sharp decline
of sensitive raw materials prices is factored in, it may be fair to
opine that the rebound in global trade is set to moderate.
A slowdown of export and import growth for the US likely would
not have nearly the impact on GDP overall that the current
weakness in the weekly leading indicators such as that of the ECRI
would suggest, although export sectors would clearly be affected.
I lay this suggestion out as a possible alternative to the "double dip"
scenarios now being widely circulated. And, I also suggest that
the volatility in the trade accounts globally may have added
substantially to the volatility of the various indicator sets.
when compared to the strong rebounds in the leading indicators,
factory orders, and the various weekly and monthly cyclical pressure
gauges I use. all these measures plunged after mid-2008 and did
rebound about as strongly through the end of April, this year. In
fact, my coincident indicators -- real wage and retail sales plus
industrial production and civilian employment -- are up but 3.2%
yr/yr through 4/10 and remain well below pre-recession peaks.
Not the strength here the leading indicators and pressure gauges
would suggest.
Given the mild recovery, the indicators should not have been so
strong. Interestingly, the BIG "V" of the indicators / gauges does
measure up very nicely with the behavior of the trade accounts
since mid - 2008. Total US trade (imports + exports) fell nearly
40% from mid- 2008 to the 4/09 trough, and has rebounded by
25% since. There is also a BIG "V" in US factory orders over the
same interval. Other major economies have also experienced
powerful swings in trade, but in all cases, exports are netted out
against imports in computing country GDPs so that the immense
swing in global trade is heavily muted when you view final
demand around the globe.
The rebound in US export sales since 4/09 has dwarfed the
recoveries in other major output categories. Thus one issue that
comes up is whether the recent weakness in the weekly pressure
gauges discussed in the Tues. post may reflect the start of
moderation in export sales. And when the recent sharp decline
of sensitive raw materials prices is factored in, it may be fair to
opine that the rebound in global trade is set to moderate.
A slowdown of export and import growth for the US likely would
not have nearly the impact on GDP overall that the current
weakness in the weekly leading indicators such as that of the ECRI
would suggest, although export sectors would clearly be affected.
I lay this suggestion out as a possible alternative to the "double dip"
scenarios now being widely circulated. And, I also suggest that
the volatility in the trade accounts globally may have added
substantially to the volatility of the various indicator sets.
Wednesday, June 16, 2010
Stocks -- Cyclicals Leadership
Cyclicals were the hands down leaders in the first phase of the
cyclical bull run. But that leadership has lost substantial momentum
as investors have been discounting an eventual moderation in the
very strong pace of earnings recovery for cyclical companies. What
may be a more important now is whether the cyclicals can avoid a
sharp downturn in relative strength, as that might well signify that
investors are losing substantial confidence in the economic recovery
story. Although relative strength of the cyclicals has flattened out in
2010, we have yet to see that sort of destructive behavior as the
chart link shows.
cyclical bull run. But that leadership has lost substantial momentum
as investors have been discounting an eventual moderation in the
very strong pace of earnings recovery for cyclical companies. What
may be a more important now is whether the cyclicals can avoid a
sharp downturn in relative strength, as that might well signify that
investors are losing substantial confidence in the economic recovery
story. Although relative strength of the cyclicals has flattened out in
2010, we have yet to see that sort of destructive behavior as the
chart link shows.
Tuesday, June 15, 2010
Stock Market & Weekly Cyclical Pressure Gauge
The weekly cyclical pressure gauge (WCPG) draws from an
array of weekly economic data such as sensitive materials prices,
unemployment insurance claims, the 2 year Treas. yield and
selected short rate data. It rarely leads the stock market. The
stock market leads the WCPG far more often. However, lead
and lag times are so close, that the WCPG is best seen as a
rough coincident indicator of the stock market and as such is
not useful for short term market timing. It does have considerable
value in helping to de-mystify the actions of the market in the
short run and it can be especially helpful when it is trending.
The WCPG made a cycle-to-date peak of 226.0 on 4/30/10.
Since then it has trended sharply lower to 204.4 as of 6/11. The
stock market went right down with it. Now, the market has been
rallying over the past week or so, and I read this as a statement
that the WCPG will soon improve. Moreover, it is doubtful that
the market will continue to rally unless the WCPG bottoms and
begins to recover relatively soon. Such a recovery would tend to
confirm a market advance, but risk is there whenever the market
front runs the indicator.
Below I show the extraordinary action of the WCPG since the last
cycle top in mid 2007.
WCPG
Cycle Top, 7/07.......................................288.0
Pre-Plunge, 7/08.....................................255.9
Cycle Trough, 3/09.................................109.4
New Cycle Peak To Date, 4/30/10..........226.0
Last Reading, 6/11/10............................204.4
This has been the most volatile period for this indicator in modern
history and it underscores the market crash / rapid price recovery
evidenced over the mid - 2008 - April, 2010 period. Truly extra-
ordinary stuff. Although the WCPG could easily remain volatile well
into 2011, it is hard to imagine such volatility would come close to
rivaling what we have seen since mid-2008.
Notice also how far below the 2007 peak the indicator remains
despite its surge off the 3/09 low. This is a nice measure of just
how far an economic recovery may have to travel to bring new
peaks in its cyclical components. There remains substantial
slack in the US economy.
I will keep you up to date on this indicator and how it fares against
the stock market going forward, as such an exercise may have
diagnostic value.
array of weekly economic data such as sensitive materials prices,
unemployment insurance claims, the 2 year Treas. yield and
selected short rate data. It rarely leads the stock market. The
stock market leads the WCPG far more often. However, lead
and lag times are so close, that the WCPG is best seen as a
rough coincident indicator of the stock market and as such is
not useful for short term market timing. It does have considerable
value in helping to de-mystify the actions of the market in the
short run and it can be especially helpful when it is trending.
The WCPG made a cycle-to-date peak of 226.0 on 4/30/10.
Since then it has trended sharply lower to 204.4 as of 6/11. The
stock market went right down with it. Now, the market has been
rallying over the past week or so, and I read this as a statement
that the WCPG will soon improve. Moreover, it is doubtful that
the market will continue to rally unless the WCPG bottoms and
begins to recover relatively soon. Such a recovery would tend to
confirm a market advance, but risk is there whenever the market
front runs the indicator.
Below I show the extraordinary action of the WCPG since the last
cycle top in mid 2007.
WCPG
Cycle Top, 7/07.......................................288.0
Pre-Plunge, 7/08.....................................255.9
Cycle Trough, 3/09.................................109.4
New Cycle Peak To Date, 4/30/10..........226.0
Last Reading, 6/11/10............................204.4
This has been the most volatile period for this indicator in modern
history and it underscores the market crash / rapid price recovery
evidenced over the mid - 2008 - April, 2010 period. Truly extra-
ordinary stuff. Although the WCPG could easily remain volatile well
into 2011, it is hard to imagine such volatility would come close to
rivaling what we have seen since mid-2008.
Notice also how far below the 2007 peak the indicator remains
despite its surge off the 3/09 low. This is a nice measure of just
how far an economic recovery may have to travel to bring new
peaks in its cyclical components. There remains substantial
slack in the US economy.
I will keep you up to date on this indicator and how it fares against
the stock market going forward, as such an exercise may have
diagnostic value.
Friday, June 11, 2010
Monetary Policy -- Short Term Liquidity Squeeze
My broad measure of credit driven financial liquidity has been flat
since late 2007, with money M-2 growth offset by the collapse of
the financial co. commercial paper market and a $250 billion roll -
off of no reserve jumbo deposits in the banking system. In essence,
a contraction of private sector credit has been offset by a large
increase in monetary liquidity as evidenced by the sizable gains
in Fed bank credit, the monetary base and M-1.
The dramatic easing of monetary policy has been essential to
source the economy in the early stage of economic recovery. A
major recovery of business sector cash flow and and personal
income buttressed by counter cyclical fiscal moves has been
sufficient to fund recovery so far without reliance on private sector
credit growth.
However, since late 2009, monetary liquidity in the system has
flattened out as the Fed has wound down special credit facilities
and the program of straightforward quantitative easing. No problem
there provided that private sector credit demand has turned around
and is growing. But it is not, so a liquidity squeeze is developing
in the financial system, which if extended substantially further, will
damage the economy and the capital markets.
If credit is not growing, a year of no real M-1 growth may be long
enough to assure recession. So, if the Fed wants to keep the economy
out of trouble, then it will have to inject more money into the system
or watch credit growth resume or allow some of both, and it may
need to do so well before the end of the year.
Normally, a liquidity squeeze of a few months duration does no
substantial economic harm. I bring the issue up because it just may
not be wise to assume the Fed is properly attuned to the risk.
In this regard, it is interesting to note that Bernanke has recently
been verbally prodding the banks to do some lending. The Fed
would like to avoid adding more liquidity directly and have the
private economy begin to source credit for a portion of its growth
instead.
since late 2007, with money M-2 growth offset by the collapse of
the financial co. commercial paper market and a $250 billion roll -
off of no reserve jumbo deposits in the banking system. In essence,
a contraction of private sector credit has been offset by a large
increase in monetary liquidity as evidenced by the sizable gains
in Fed bank credit, the monetary base and M-1.
The dramatic easing of monetary policy has been essential to
source the economy in the early stage of economic recovery. A
major recovery of business sector cash flow and and personal
income buttressed by counter cyclical fiscal moves has been
sufficient to fund recovery so far without reliance on private sector
credit growth.
However, since late 2009, monetary liquidity in the system has
flattened out as the Fed has wound down special credit facilities
and the program of straightforward quantitative easing. No problem
there provided that private sector credit demand has turned around
and is growing. But it is not, so a liquidity squeeze is developing
in the financial system, which if extended substantially further, will
damage the economy and the capital markets.
If credit is not growing, a year of no real M-1 growth may be long
enough to assure recession. So, if the Fed wants to keep the economy
out of trouble, then it will have to inject more money into the system
or watch credit growth resume or allow some of both, and it may
need to do so well before the end of the year.
Normally, a liquidity squeeze of a few months duration does no
substantial economic harm. I bring the issue up because it just may
not be wise to assume the Fed is properly attuned to the risk.
In this regard, it is interesting to note that Bernanke has recently
been verbally prodding the banks to do some lending. The Fed
would like to avoid adding more liquidity directly and have the
private economy begin to source credit for a portion of its growth
instead.
Thursday, June 10, 2010
Tomorrow Is Just Another Important Day
Well, we have experienced several spirited one day bounces since
the stock market correction started in late April. Today's pop
has better technical underpinnings, but it will just be another
temporary respite if we do not see some follow through over the
next several sessions. The boyz will be watching the overnight
action abroad and the US futures as the book gets moved. The
market closed today right at its downtrend line. It would have
been more bullish had it taken out the trend line. Moreover,
Friday could see some selling as some of the boyz net out for
fear that Upper Slobovia or some other EU province may
announce debt roll over concerns over the week end. Good
test of the market straight ahead....Chart.
the stock market correction started in late April. Today's pop
has better technical underpinnings, but it will just be another
temporary respite if we do not see some follow through over the
next several sessions. The boyz will be watching the overnight
action abroad and the US futures as the book gets moved. The
market closed today right at its downtrend line. It would have
been more bullish had it taken out the trend line. Moreover,
Friday could see some selling as some of the boyz net out for
fear that Upper Slobovia or some other EU province may
announce debt roll over concerns over the week end. Good
test of the market straight ahead....Chart.
Monday, June 07, 2010
US Dollar
The volatility of the major currencies against one another since the
inception of floating exchange rates in the 1970s continues to amaze
me. My long held suspicion is that the dealers run 'em up and down
over time to turn a nice profit and cover all the overhead.
At any rate, the USD has been on a tear lately at the expense of most
of the other majors and the Euro in particular. You are no doubt well
briefed on the problems the EU is having as well as the changeover in
PM status in Japan which might favor a weaker Yen.
The USD is now overbought 0n 40 day RSI, and is getting extended
against its current uptrend. It is also overbought against its 50 day
m/a. It stands at important 18 - 20 month resistance as well. Thus,
the game of chasing the dollar up has reached an important testing
point. Should the nervousness about the EU persist, and should
Japan start talking the Yen down, the next critical resistance
level for the dollar is at $USD 92 -- a level which runs back to 2005.
$USD chart.
inception of floating exchange rates in the 1970s continues to amaze
me. My long held suspicion is that the dealers run 'em up and down
over time to turn a nice profit and cover all the overhead.
At any rate, the USD has been on a tear lately at the expense of most
of the other majors and the Euro in particular. You are no doubt well
briefed on the problems the EU is having as well as the changeover in
PM status in Japan which might favor a weaker Yen.
The USD is now overbought 0n 40 day RSI, and is getting extended
against its current uptrend. It is also overbought against its 50 day
m/a. It stands at important 18 - 20 month resistance as well. Thus,
the game of chasing the dollar up has reached an important testing
point. Should the nervousness about the EU persist, and should
Japan start talking the Yen down, the next critical resistance
level for the dollar is at $USD 92 -- a level which runs back to 2005.
$USD chart.
Friday, June 04, 2010
Stock Market -- Technical
The past two week period was the 13 - 15 wk. cycle bottom time
frame. The market should have begun to rally over the past few
days. No such thing. I am looking to go long next week anyway as
my NYSE adv. / dec. oscillator is signaling a tradeworthy oversold.
I still keep track of the TRIN indicator. It is not as useful a measure
as once it was. The NYSE TRIN represents volume per declining
share divided by volume per advancing share. When the ratio is
above 1.00, net selling pressure is indicated. When the 21 day TRIN
tops 1.50, it indicates heavy selling pressure. I have linked to a
chart of the NYSE TRIN with 21 and 40 day moving averages. The
TRIN action over the past month suggests a build toward climactic
selling (today), and the 21 and 40 day averages are fabulously
oversold, topping or matching levels seen in the big bear days of
2008. Just nutty stuff. Chart.
frame. The market should have begun to rally over the past few
days. No such thing. I am looking to go long next week anyway as
my NYSE adv. / dec. oscillator is signaling a tradeworthy oversold.
I still keep track of the TRIN indicator. It is not as useful a measure
as once it was. The NYSE TRIN represents volume per declining
share divided by volume per advancing share. When the ratio is
above 1.00, net selling pressure is indicated. When the 21 day TRIN
tops 1.50, it indicates heavy selling pressure. I have linked to a
chart of the NYSE TRIN with 21 and 40 day moving averages. The
TRIN action over the past month suggests a build toward climactic
selling (today), and the 21 and 40 day averages are fabulously
oversold, topping or matching levels seen in the big bear days of
2008. Just nutty stuff. Chart.
Economic Indicators
The monthly leading economic indicators, which key heavily on
new orders, remain strong. The weekly leading indicator sets
made interim cyclical highs at the end of April and were quite
weak in May. Notable were lower stock and sensitive materials
prices and an unexpected increase in initial unemployment ins.
claims. (The weeklies have a time edge on the monthlies.)
The increases in the weekly leader data sets from cycle troughs to
recent peaks were the strongest on record and, I believe , reflected
the strongest ever readings on my long term leading indicators. The
longer term indicators are positive but have lost momentum. The
main reasons for more modest longer term readings are an easing in
the growth of the real wage and in the advance of monetary liquidity.
So, a loss of momentum in the short term weekly data was to be
expected, but the sharp turn to weakness is a surprise. Moreover,
further sharp weakness in the near term would in my view raise
suspicion about the viability of the recovery. At this stage, I am
planning to wait until mid-July to cross that bridge.
there are plenty of scary stories out there, but what has caught my
attention has been the strength of total new factory orders ( up 20%
yr / yr) relative to US final demand. This is a very uneven
comparison even after one takes into account the strong export
order book and consequent sales. The suggestion here is that the
inventory pipelines could be getting filled more rapidly than final
sellers desire.
new orders, remain strong. The weekly leading indicator sets
made interim cyclical highs at the end of April and were quite
weak in May. Notable were lower stock and sensitive materials
prices and an unexpected increase in initial unemployment ins.
claims. (The weeklies have a time edge on the monthlies.)
The increases in the weekly leader data sets from cycle troughs to
recent peaks were the strongest on record and, I believe , reflected
the strongest ever readings on my long term leading indicators. The
longer term indicators are positive but have lost momentum. The
main reasons for more modest longer term readings are an easing in
the growth of the real wage and in the advance of monetary liquidity.
So, a loss of momentum in the short term weekly data was to be
expected, but the sharp turn to weakness is a surprise. Moreover,
further sharp weakness in the near term would in my view raise
suspicion about the viability of the recovery. At this stage, I am
planning to wait until mid-July to cross that bridge.
there are plenty of scary stories out there, but what has caught my
attention has been the strength of total new factory orders ( up 20%
yr / yr) relative to US final demand. This is a very uneven
comparison even after one takes into account the strong export
order book and consequent sales. The suggestion here is that the
inventory pipelines could be getting filled more rapidly than final
sellers desire.
Wednesday, June 02, 2010
Not Quite Loafing
Posting has been light over the past couple of weeks. I have taken
a little time out to enjoy my retirement, supervise some property
clean up from the winter storms, and do some thinking about how
best to portray the likely economic / financial environment for the
rest of 2010. I think I am closing in on the latter, so the posting
pace should pick up soon. I use a bunch of boom / bust type
economic and financial indicators to do my work, and looking back,
the volatility these indicators have exhibited has been extraordinary
since mid - 2008. The indicators show a "V" pattern pretty much
across the board, but that "V" appears to have broken off, so now
the job is to get the right handle going forward and to do so without
overreacting and, avoid heavy reliance on verbal hedging.
a little time out to enjoy my retirement, supervise some property
clean up from the winter storms, and do some thinking about how
best to portray the likely economic / financial environment for the
rest of 2010. I think I am closing in on the latter, so the posting
pace should pick up soon. I use a bunch of boom / bust type
economic and financial indicators to do my work, and looking back,
the volatility these indicators have exhibited has been extraordinary
since mid - 2008. The indicators show a "V" pattern pretty much
across the board, but that "V" appears to have broken off, so now
the job is to get the right handle going forward and to do so without
overreacting and, avoid heavy reliance on verbal hedging.
Wednesday, May 26, 2010
Stock Market In Perspective
Early last autumn, when I turned more cautious on the market, it
was on an astoundingly strong trajectory. Even after the Jan. ' 10
break, it was still on a trajectory that would have taken the SP 500
to new record highs by year's end. Not impossible, but not a good
bet, either. So, yes, the rise in the market was too steep, but it was
partly understandable given the extraordinary rebound of corporate
profits.
My SP 500 Market Tracker currently projects the index to rise 25%
from current levels to 1350 by year-end 2010 as 12 month net per
share surges higher. From a technical perspective, this would put the
market on a trajectory that is still extremely strong by price chart
standards, but the Tracker is merely assigning a moderate 16.5 p/e
to earning power in excess of $80 per share.
Now, here is where it gets more tricky. S&P profits have exceeded
those suggested by the sharp run ups in my leading indicator sets
reflecting the deep cost cutting companies have undertaken. Since
the bulk of the cost cutting is past, profit growth was bound to
moderate. Moreover, when measured on yr/yr % change, the
weekly economic leading indicators have hit and have just crossed
an inflection point, signaling that a slowing of profits growth is out
ahead. A significant slowdown in profits momentum is factored into
the $80+ per share projection for the "500". But, there is a problem.
Once the leading indicators break the initial recovery signal surge,
further upside momentum of the indicators is not only far more
mild, it is more difficult to project with confidence. On top of that,
the "fit" between the indicators and the profit trend loosens past
the inflection point of the indicators, although it must be said that
profits often do better than expected anyway.
The long and short of it is that with a sharp moderation in the trend
of the leading indicators underway, the stock market could not hold
a nearly impossibly strong price trend and has corrected since a clear
signal has been sent that profits growth is going to slow. This is
the fundamental event I warned about last autumn, an event that
came later than expected.
I am on the hook for expecting a solid year of economic and profits
recovery in 2010 and for expecting a continuation of the cyclical bull
market. Since earnings currently remain in a sharp upswing, I
think the market has overshot to the downside by 10%, although
conceding that a reaction of real consequence was required given
the extraordinary trajectory of the market from 3/09 - 4/10.
I expect a sharp recovery rally to get underway over the next 5-7
trading days. But I do see a period of uncertainty ahead for a couple
of months until we see how well the leading economic indicators
progress.
was on an astoundingly strong trajectory. Even after the Jan. ' 10
break, it was still on a trajectory that would have taken the SP 500
to new record highs by year's end. Not impossible, but not a good
bet, either. So, yes, the rise in the market was too steep, but it was
partly understandable given the extraordinary rebound of corporate
profits.
My SP 500 Market Tracker currently projects the index to rise 25%
from current levels to 1350 by year-end 2010 as 12 month net per
share surges higher. From a technical perspective, this would put the
market on a trajectory that is still extremely strong by price chart
standards, but the Tracker is merely assigning a moderate 16.5 p/e
to earning power in excess of $80 per share.
Now, here is where it gets more tricky. S&P profits have exceeded
those suggested by the sharp run ups in my leading indicator sets
reflecting the deep cost cutting companies have undertaken. Since
the bulk of the cost cutting is past, profit growth was bound to
moderate. Moreover, when measured on yr/yr % change, the
weekly economic leading indicators have hit and have just crossed
an inflection point, signaling that a slowing of profits growth is out
ahead. A significant slowdown in profits momentum is factored into
the $80+ per share projection for the "500". But, there is a problem.
Once the leading indicators break the initial recovery signal surge,
further upside momentum of the indicators is not only far more
mild, it is more difficult to project with confidence. On top of that,
the "fit" between the indicators and the profit trend loosens past
the inflection point of the indicators, although it must be said that
profits often do better than expected anyway.
The long and short of it is that with a sharp moderation in the trend
of the leading indicators underway, the stock market could not hold
a nearly impossibly strong price trend and has corrected since a clear
signal has been sent that profits growth is going to slow. This is
the fundamental event I warned about last autumn, an event that
came later than expected.
I am on the hook for expecting a solid year of economic and profits
recovery in 2010 and for expecting a continuation of the cyclical bull
market. Since earnings currently remain in a sharp upswing, I
think the market has overshot to the downside by 10%, although
conceding that a reaction of real consequence was required given
the extraordinary trajectory of the market from 3/09 - 4/10.
I expect a sharp recovery rally to get underway over the next 5-7
trading days. But I do see a period of uncertainty ahead for a couple
of months until we see how well the leading economic indicators
progress.
Monday, May 24, 2010
Stock Market -- Technical
The confirmed short term downtrend is obvious enough. the market
is substantially oversold and is at levels to support a rally. But, one
right an oversold market has, is to get itself more oversold. I do not
short significant oversolds, so my penchant now for a trade is to look
for a bounce / recovery, and at a minimum the preference is to first
see some stabilization in the short term price oscillators as this
development would signify a loss in negative price momentum.
The market did not make a classic serious top. The bad news is that
we have an uncharacteristically deep short term oversold for a
cyclical bull market. and that means you have to be more cautious
on the long side with perhaps a gradual fill when you get the short
term set-up you prefer.
When I look at my NYSE buying pressure vs. selling pressure
measures, the market is moderately oversold at -50 and deeply
and very reliably oversold at below -100. We are currently a
tad below -50, so this measure is still risky. My cycle work
suggests a 13 - 15 week bottoming pattern is just now upon us.
So, there could be a sharp price recovery in place by the end of
next week.
I try to keep technical and fundamental analysis separate on the
premise that when two widely different disciplines tell you the same
thing, your chances of being correct are better than when you rely
on just one discipline. But, sometimes using both techniques in
one analysis can be handy, and I plan to do that a little later this
week.
SP 500 weekly chart.
is substantially oversold and is at levels to support a rally. But, one
right an oversold market has, is to get itself more oversold. I do not
short significant oversolds, so my penchant now for a trade is to look
for a bounce / recovery, and at a minimum the preference is to first
see some stabilization in the short term price oscillators as this
development would signify a loss in negative price momentum.
The market did not make a classic serious top. The bad news is that
we have an uncharacteristically deep short term oversold for a
cyclical bull market. and that means you have to be more cautious
on the long side with perhaps a gradual fill when you get the short
term set-up you prefer.
When I look at my NYSE buying pressure vs. selling pressure
measures, the market is moderately oversold at -50 and deeply
and very reliably oversold at below -100. We are currently a
tad below -50, so this measure is still risky. My cycle work
suggests a 13 - 15 week bottoming pattern is just now upon us.
So, there could be a sharp price recovery in place by the end of
next week.
I try to keep technical and fundamental analysis separate on the
premise that when two widely different disciplines tell you the same
thing, your chances of being correct are better than when you rely
on just one discipline. But, sometimes using both techniques in
one analysis can be handy, and I plan to do that a little later this
week.
SP 500 weekly chart.
Friday, May 21, 2010
Inflation Potential
Gauges which signal future inflation rebounded dramatically over
roughly the past year or so. However, the rebound in the pressure
gauges merely signaled from deflation to mild inflation. Moreover,
as a result of recent weakness in commodities prices, inflation
thrust has fizzled in the short run. (CRB commodities chart)
Commodities were set to be the inflation driver this year as they
were in 2009. Last year, commodities rose rapidly on a strong
global economic turnaround off very depressed levels, but that
price uptrend was broken earlier this year as traders figured
that inventory pipeline refilling would be complete by mid - 2010.
There has been extra downward pressure on the CRB recently as
China -- a major buyer of raw materials -- has been signaling it
desires to avoid overheating -- and as traders handicap a
presumed slowdown in Europe's recovery in the wake of the
recent uproar over debt addled EU members such as Greece
and Spain.
Now, note that the CRB is moving toward an oversold situation in
the short run, and note too, that commodities can be volatile.
Thus, one cannot vouchsafe a flattish CPI for more than a couple
of months.
My longer range inflation thrust measure, which keys off the US
capacity utilization rate and the leading economic indicators, is
currently very tame for 2010, but suggests a sharp acceleration
of inflation pressure in 2011 as operating rates rise significantly
further and cost pressures build broadly. These currently still
low broader measures of economic activity have indeed partially
offset the impact for the inflation picture from commodities over
the past year, but that could all change in 2011 as economic
recovery progresses.
roughly the past year or so. However, the rebound in the pressure
gauges merely signaled from deflation to mild inflation. Moreover,
as a result of recent weakness in commodities prices, inflation
thrust has fizzled in the short run. (CRB commodities chart)
Commodities were set to be the inflation driver this year as they
were in 2009. Last year, commodities rose rapidly on a strong
global economic turnaround off very depressed levels, but that
price uptrend was broken earlier this year as traders figured
that inventory pipeline refilling would be complete by mid - 2010.
There has been extra downward pressure on the CRB recently as
China -- a major buyer of raw materials -- has been signaling it
desires to avoid overheating -- and as traders handicap a
presumed slowdown in Europe's recovery in the wake of the
recent uproar over debt addled EU members such as Greece
and Spain.
Now, note that the CRB is moving toward an oversold situation in
the short run, and note too, that commodities can be volatile.
Thus, one cannot vouchsafe a flattish CPI for more than a couple
of months.
My longer range inflation thrust measure, which keys off the US
capacity utilization rate and the leading economic indicators, is
currently very tame for 2010, but suggests a sharp acceleration
of inflation pressure in 2011 as operating rates rise significantly
further and cost pressures build broadly. These currently still
low broader measures of economic activity have indeed partially
offset the impact for the inflation picture from commodities over
the past year, but that could all change in 2011 as economic
recovery progresses.
Thursday, May 20, 2010
Stock Market -- Fundamentals
Core fundamentals -- interest rates, liquidity, confidence measures
remain positive and support continuation of an "easy money"
cyclical bull market.There has been some slippage in the indicators.
This is entirely normal and I note that the erosion is from nearly
unprecedentedly strong levels.
Corp. earnings remain in a strong uptrend and continue to accelerate
relative to the long run trend. Importantly, profits, though rising,
remain well below levels that would signal a cyclical peak and
fundamental trouble for the market.
My SP500 Market Tracker, which started to bottom a year or so
ago with a value of 655, has jumped to the 1190 level on a dramatic
recovery of earning power. For most of the cyclical bull run since
3/09, the SP 500 actual has traded at a substantial premium to the
Tracker value. With the recent sell-off, however, the market is
currently running at a 9.6% discount. So, the market is now
attractive relative to fair value as the Tracker has caught up with
and surpassed the index. Estimated Tracker value based on full
year 2010 expected earnings is just shy of 1350 and I do not have
an issue with that number at this time.
Now for a couple of secondary indicators. The sharp run-up in the
real price of oil off its 2009 low did not appear to have damaged the
market. Moreover, the oil price has recently sold off sharply along
with the stock market. Thus, the oil price indicator has not been
useful so far. The other secondary indicator concerns financial
liquidity and this requires some discussion.
The large liquidity tailwinds the stock market enjoyed over 2009
have ended. For example, combined retail and institutional money
market funds aggregated a record $3.50 tril. in 3/o9. By the end of
April, 2010 the combined mm fund total stood at $2.66 tril., or 24%
below the '09 record. In turn, the $2.66 tril. of 4/10 compares with
the $2.9 tril. on hand in mm funds at y/e 2007. In short, the large
build up of cash that occurred over the recession and the deep bear
market has been more than fully drawn down. Also note that total
system financial liquidity has been shrinking mildly while real
economic output has been rising. Thus, the liquidity tailwinds
have reversed course viv a vis the stock market, and are now
headwinds. This is a short term issue for the stock market, but
you have to be careful not to draw dire conclusions yet, since
economic recovery will prompt mm fund growth and, eventually,
private sector credit growth, which will expand the base of liquidity
available to the capital markets. However, suffice it to say that since
the Sp 500 is dramatically above the 2009 cyclical low, plenty of the
bucks available have been put into play.
remain positive and support continuation of an "easy money"
cyclical bull market.There has been some slippage in the indicators.
This is entirely normal and I note that the erosion is from nearly
unprecedentedly strong levels.
Corp. earnings remain in a strong uptrend and continue to accelerate
relative to the long run trend. Importantly, profits, though rising,
remain well below levels that would signal a cyclical peak and
fundamental trouble for the market.
My SP500 Market Tracker, which started to bottom a year or so
ago with a value of 655, has jumped to the 1190 level on a dramatic
recovery of earning power. For most of the cyclical bull run since
3/09, the SP 500 actual has traded at a substantial premium to the
Tracker value. With the recent sell-off, however, the market is
currently running at a 9.6% discount. So, the market is now
attractive relative to fair value as the Tracker has caught up with
and surpassed the index. Estimated Tracker value based on full
year 2010 expected earnings is just shy of 1350 and I do not have
an issue with that number at this time.
Now for a couple of secondary indicators. The sharp run-up in the
real price of oil off its 2009 low did not appear to have damaged the
market. Moreover, the oil price has recently sold off sharply along
with the stock market. Thus, the oil price indicator has not been
useful so far. The other secondary indicator concerns financial
liquidity and this requires some discussion.
The large liquidity tailwinds the stock market enjoyed over 2009
have ended. For example, combined retail and institutional money
market funds aggregated a record $3.50 tril. in 3/o9. By the end of
April, 2010 the combined mm fund total stood at $2.66 tril., or 24%
below the '09 record. In turn, the $2.66 tril. of 4/10 compares with
the $2.9 tril. on hand in mm funds at y/e 2007. In short, the large
build up of cash that occurred over the recession and the deep bear
market has been more than fully drawn down. Also note that total
system financial liquidity has been shrinking mildly while real
economic output has been rising. Thus, the liquidity tailwinds
have reversed course viv a vis the stock market, and are now
headwinds. This is a short term issue for the stock market, but
you have to be careful not to draw dire conclusions yet, since
economic recovery will prompt mm fund growth and, eventually,
private sector credit growth, which will expand the base of liquidity
available to the capital markets. However, suffice it to say that since
the Sp 500 is dramatically above the 2009 cyclical low, plenty of the
bucks available have been put into play.
Wednesday, May 19, 2010
Post Traumatic Stress & Profit Taking
One of my concerns about the stock market over recent months
has been the potential for a collective emotional backslide that
could be triggered by events that remind investors of the original
trauma of the economic / financial crisis of 2007 - early 2009.
I think it is crazy to expect that investors would skate right out of
that nightmare without experiencing subsequent shivers or
without looking back. The problems the EU is encountering and
some mild policy tightening by China have been the catalysts to
have ignited fears.
And, of course, from the 3/09 low into 4/10, the SP 500 advanced
by a staggering 80+%. That advance included the funky, out-of-
place rally of the early spring. What better time for a bunch of
traders to finally take profits?
I do not want to minimize the various problems the EU is facing
now nor do I wish to wave off China's mild tilt toward temperance.
But these are issues that are being encountered in a global economic
recovery with unprecedented monetary and fiscal support. I will
keep an eye on these problems, but as of now, I think the risks
they pose are rather mild.
I am leaning more to the diagnosis of post traumatic stress jitters
coupled with good old fashioned profit taking and portfolio
restructuring to account for the recent flight from risk taking. Yet,
you have to be respectful of these factors as a re-stoking of the old
fears and the profit motive are all too human.
has been the potential for a collective emotional backslide that
could be triggered by events that remind investors of the original
trauma of the economic / financial crisis of 2007 - early 2009.
I think it is crazy to expect that investors would skate right out of
that nightmare without experiencing subsequent shivers or
without looking back. The problems the EU is encountering and
some mild policy tightening by China have been the catalysts to
have ignited fears.
And, of course, from the 3/09 low into 4/10, the SP 500 advanced
by a staggering 80+%. That advance included the funky, out-of-
place rally of the early spring. What better time for a bunch of
traders to finally take profits?
I do not want to minimize the various problems the EU is facing
now nor do I wish to wave off China's mild tilt toward temperance.
But these are issues that are being encountered in a global economic
recovery with unprecedented monetary and fiscal support. I will
keep an eye on these problems, but as of now, I think the risks
they pose are rather mild.
I am leaning more to the diagnosis of post traumatic stress jitters
coupled with good old fashioned profit taking and portfolio
restructuring to account for the recent flight from risk taking. Yet,
you have to be respectful of these factors as a re-stoking of the old
fears and the profit motive are all too human.
Friday, May 14, 2010
Oil Price -- Interesting Moment
Greybeard traders know that oil often experiences moderate
seasonal price weakness running from late April into June / July.
The big seasonal build of petrol stocks completes in the spring
and demand eases off. Gasoline production is up about 5% this
year in the US, providing extra stock for the upcoming prime
driving season. But Jun. '10 oil has plunged from near $88 bl. in
April to close near $71.50 today. Down 18.5%, this is not your
mild seasonal dip.
Traders have concerns beyond goodly refined product supply. They
have taken note that China -- a huge crude buyer -- is inching along
toward a tighter monetary policy. they see that to preserve the EU
as it stands, southern and far eastern Europe are under pressure
from the markets to reduce budget deficits. And, they are taking into
account continuing Euro weakness and US dollar strength as the
markets adjust for a more sluggish and fractious EU vs. the US.
The crack in the oil market has penalized sector investors, but it
will also work to reduce cyclical inflation pressure and enhance the
real wage in the US which are plus factors for the economy.
The weakness in the oil price has broken its uptrend off the early
2009 cyclical low and it has brought oil down to an important
support level. The price drop is leading to development of a sharp
short term oversold condition, which might well give players a
longside shot at moderate seasonal price strength starting late in
the summer.
Right now the psychology for oil is not good what with the
realizations that Europe may grow more slowly and that China is
now snugging up on policy. We have to wait a bit on the EU, but I
doubt China is prepared to slam the door on growth. Given the
grand power of the central gov., China can play stop / go with
monetary policy far more freely than can governments in the
West.
If you are like me, and drive and heat your home with oil, an
opportunity to hedge your cost with a long position in an oversold
oil market is worth keeping an eye on. Oil price chart.
seasonal price weakness running from late April into June / July.
The big seasonal build of petrol stocks completes in the spring
and demand eases off. Gasoline production is up about 5% this
year in the US, providing extra stock for the upcoming prime
driving season. But Jun. '10 oil has plunged from near $88 bl. in
April to close near $71.50 today. Down 18.5%, this is not your
mild seasonal dip.
Traders have concerns beyond goodly refined product supply. They
have taken note that China -- a huge crude buyer -- is inching along
toward a tighter monetary policy. they see that to preserve the EU
as it stands, southern and far eastern Europe are under pressure
from the markets to reduce budget deficits. And, they are taking into
account continuing Euro weakness and US dollar strength as the
markets adjust for a more sluggish and fractious EU vs. the US.
The crack in the oil market has penalized sector investors, but it
will also work to reduce cyclical inflation pressure and enhance the
real wage in the US which are plus factors for the economy.
The weakness in the oil price has broken its uptrend off the early
2009 cyclical low and it has brought oil down to an important
support level. The price drop is leading to development of a sharp
short term oversold condition, which might well give players a
longside shot at moderate seasonal price strength starting late in
the summer.
Right now the psychology for oil is not good what with the
realizations that Europe may grow more slowly and that China is
now snugging up on policy. We have to wait a bit on the EU, but I
doubt China is prepared to slam the door on growth. Given the
grand power of the central gov., China can play stop / go with
monetary policy far more freely than can governments in the
West.
If you are like me, and drive and heat your home with oil, an
opportunity to hedge your cost with a long position in an oversold
oil market is worth keeping an eye on. Oil price chart.
Wednesday, May 12, 2010
Stock Market -- Technical
The normal admonition is to say beware of spike bottoms, as
long term history shows they hold up no more than 50% of the
time in bull markets. Yet, this cyclical advance has relished spike
bottoms, so traders need to have that fact in mind.
The sharp decline in the market last week wiped out the over-
boughts across the time spectrum and left the market deeply
oversold on a short term basis. The deep sell-off ended abruptly
but started gradually enough to provide trade worthy shorts
which should have been covered on Friday.
As we moved into this week, I found I no longer had a firm technical
case for urging caution as much of the excess was wrung out in
sudden fashion.
This week the market has rallied sharply from a deep short term
oversold up to neutral. The market is in a confirmed short term
downtrend, but has been strong enough this week to make it
reasonable to expect a test of the short term downtrend line, which
if breached on the upside, would be a preliminary signal that a
positive reversal might be in order.
I did have a short position coming into last week's decline. That
position was closed on 5/7. I have not jumped into the market
on the long side and will probably look to see whether there is a
confirmed positive short term reversal before coming off the
sidelines.
I have to warn that I am now charting off closing prices as
I am unclear as to how much of the tape on Thursday, May 6 will
turn out to involve broken and hence phantom trades. Chart.
long term history shows they hold up no more than 50% of the
time in bull markets. Yet, this cyclical advance has relished spike
bottoms, so traders need to have that fact in mind.
The sharp decline in the market last week wiped out the over-
boughts across the time spectrum and left the market deeply
oversold on a short term basis. The deep sell-off ended abruptly
but started gradually enough to provide trade worthy shorts
which should have been covered on Friday.
As we moved into this week, I found I no longer had a firm technical
case for urging caution as much of the excess was wrung out in
sudden fashion.
This week the market has rallied sharply from a deep short term
oversold up to neutral. The market is in a confirmed short term
downtrend, but has been strong enough this week to make it
reasonable to expect a test of the short term downtrend line, which
if breached on the upside, would be a preliminary signal that a
positive reversal might be in order.
I did have a short position coming into last week's decline. That
position was closed on 5/7. I have not jumped into the market
on the long side and will probably look to see whether there is a
confirmed positive short term reversal before coming off the
sidelines.
I have to warn that I am now charting off closing prices as
I am unclear as to how much of the tape on Thursday, May 6 will
turn out to involve broken and hence phantom trades. Chart.
Monday, May 10, 2010
Economic Indicators
Leading Indicators
As discussed previously, global leading economic indicators did
flatten out over the 9/09 - 2/10 period following rapid recovery
earlier last year. This was true of the eurozone and no doubt added
to creditor concerns regarding the weaker links such as Greece. The
good news is that there has been substantial improvement in more
recent months both in the eurozone and around the globe.
US weekly leading indicators have regained positive momentum
after a Jan. - Feb. '10 dip. US monthly leaders also remain strong.
The improvement in the breadth of new orders has been steady
enough, and although high, remains below record levels. The $ trend
of new orders has also accelerated sharply off the low early 2009
base.
Yr/yr % momentum of the leading indicators may be peaking now,
but momentum has been unusually strong and signals good growth
in output and profits through Aug. '10.
My Economic Power Index is now showing recovery again. The
yr/yr change in the real wage has flattened out but is holding up
better than earlier expected, and the yr/yr change in employment,
although still negative is improving rapidly. The index looks set to
break out of a broad three year downtrend in the months ahead.
At this juncture the continuing expansion in jobs held is necessary
to sustain consumer confidence and spending. Internet job listings
have jumped in recent months and have reversed a steep downtrend
in place since late 2007.
The Business Strength Index has recovered enough to signal
that the Fed should raise short rates. However, the capacity
utilization component is still low by the Fed's reckoning, and there
has also yet to be a decisive turn in short term business credit
demand (The re-activation of swap agreements between the Fed
and Europe's central banks could also affect US monetary policy
in the short run).
There remains large slack in the US economic system and this
now includes banking system liquidity. Thus, the economic
recovery continues to have the potential to be a lengthy one.
As discussed previously, global leading economic indicators did
flatten out over the 9/09 - 2/10 period following rapid recovery
earlier last year. This was true of the eurozone and no doubt added
to creditor concerns regarding the weaker links such as Greece. The
good news is that there has been substantial improvement in more
recent months both in the eurozone and around the globe.
US weekly leading indicators have regained positive momentum
after a Jan. - Feb. '10 dip. US monthly leaders also remain strong.
The improvement in the breadth of new orders has been steady
enough, and although high, remains below record levels. The $ trend
of new orders has also accelerated sharply off the low early 2009
base.
Yr/yr % momentum of the leading indicators may be peaking now,
but momentum has been unusually strong and signals good growth
in output and profits through Aug. '10.
My Economic Power Index is now showing recovery again. The
yr/yr change in the real wage has flattened out but is holding up
better than earlier expected, and the yr/yr change in employment,
although still negative is improving rapidly. The index looks set to
break out of a broad three year downtrend in the months ahead.
At this juncture the continuing expansion in jobs held is necessary
to sustain consumer confidence and spending. Internet job listings
have jumped in recent months and have reversed a steep downtrend
in place since late 2007.
The Business Strength Index has recovered enough to signal
that the Fed should raise short rates. However, the capacity
utilization component is still low by the Fed's reckoning, and there
has also yet to be a decisive turn in short term business credit
demand (The re-activation of swap agreements between the Fed
and Europe's central banks could also affect US monetary policy
in the short run).
There remains large slack in the US economic system and this
now includes banking system liquidity. Thus, the economic
recovery continues to have the potential to be a lengthy one.
Friday, May 07, 2010
Stock Market Update
I am away from my home office and am posting this on a remote
terminal, so I will keep it brief. Since last autumn, I have cautioned
about the stock market potential from several different perspectives.
Basically, I have argued for over a year that the advance from 3/09
represented not only a cyclical bull market, but a potentially powerful
one if anticipated strong earnings could be delivered smoothly. Even
so, by autumn of 2009, I came to regard the trajectory of the upmove
to be too strong. Not reckless, but unsustainable. This caution was
extended when the 2/10 rally broke out to new cyclical highs after
completion of a classical cyclical upleg. It marked the untimely arrival
of the "johnny-come-lateleys".
The recent sharp sell off has gone along way toward eliminating the
overheated trajectory of the market and has ended the rally from the
late arrivals. It has brought the market to a more logical place and
has eliminated the overbought condition. Chart.
terminal, so I will keep it brief. Since last autumn, I have cautioned
about the stock market potential from several different perspectives.
Basically, I have argued for over a year that the advance from 3/09
represented not only a cyclical bull market, but a potentially powerful
one if anticipated strong earnings could be delivered smoothly. Even
so, by autumn of 2009, I came to regard the trajectory of the upmove
to be too strong. Not reckless, but unsustainable. This caution was
extended when the 2/10 rally broke out to new cyclical highs after
completion of a classical cyclical upleg. It marked the untimely arrival
of the "johnny-come-lateleys".
The recent sharp sell off has gone along way toward eliminating the
overheated trajectory of the market and has ended the rally from the
late arrivals. It has brought the market to a more logical place and
has eliminated the overbought condition. Chart.
Wednesday, May 05, 2010
Stock Market -- Short Term Technical
For weeks now, schooled technicians have known the market was
overbought. A correction or consolidation was thus widely
anticipated. Well, we have a correction which has quickly wiped
out the short term overbought and brought the market into a
mildly oversold condition with the SP 500 at 1166.
A bit more weakness over the next several days would lend
confirmation to the downtrend in place as the 10 and 25 day m/a's
would both be down and a longer term trendline pegged off the
3/09 and 2/10 lows would likely be broken.
So there is trendline support around 1160 on the SP 500 and there
is obvious support at 1150. A more attractive and deeper oversold
would develop down in the 1125 - 1135 range.
The abatement of selling pressure today lends hope to the idea the
market could stabilize for a spell in the days ahead, but that is a
hope only.
From a trading perspective, I would prefer to see further weakness
down to the 1125 - 1135 range before dropping the shorting
mentality and looking long again.
SP 500 chart.
overbought. A correction or consolidation was thus widely
anticipated. Well, we have a correction which has quickly wiped
out the short term overbought and brought the market into a
mildly oversold condition with the SP 500 at 1166.
A bit more weakness over the next several days would lend
confirmation to the downtrend in place as the 10 and 25 day m/a's
would both be down and a longer term trendline pegged off the
3/09 and 2/10 lows would likely be broken.
So there is trendline support around 1160 on the SP 500 and there
is obvious support at 1150. A more attractive and deeper oversold
would develop down in the 1125 - 1135 range.
The abatement of selling pressure today lends hope to the idea the
market could stabilize for a spell in the days ahead, but that is a
hope only.
From a trading perspective, I would prefer to see further weakness
down to the 1125 - 1135 range before dropping the shorting
mentality and looking long again.
SP 500 chart.
Sunday, May 02, 2010
The Lever On The Way Up Is The Screw On The Way Down
Once leverage or borrowing gets into the game, the borrower needs
to generate the cash flow to service the debt and to generate
sufficient income to manage expenses and have enough left over to
get the return on equity boost leverage can bring. Credits get
shaky as debt service outlays begin to consume large portions of
cash flow. Credit quality erodes even faster when cash flow is
unstable and its visibility is called into question. Tossing about
leverage ratios without regard to how well debt is being serviced
and without a careful analysis of a borrower's income and cash
flows is an idle game.
Which brings us to the European Union where debt ratios are high
and where income / cash flow are now under pressure at the state
level. The economic recovery is but inching forward in the eurozone.
The revenue take of sovereigns is under pressure, and state
spending has been pushed higher to fund recession countermeasures
such as unemployment insurance. The problem is now being
compounded by sharply rising funding costs for Greece, Spain et al
as investors worry about debt service capability in the present
but down the road as well if greater austerity drags incomes further
down as a result of restructuring programs.
Sound thinker Edward Hugh holds forth on the subject for the
EU here.
to generate the cash flow to service the debt and to generate
sufficient income to manage expenses and have enough left over to
get the return on equity boost leverage can bring. Credits get
shaky as debt service outlays begin to consume large portions of
cash flow. Credit quality erodes even faster when cash flow is
unstable and its visibility is called into question. Tossing about
leverage ratios without regard to how well debt is being serviced
and without a careful analysis of a borrower's income and cash
flows is an idle game.
Which brings us to the European Union where debt ratios are high
and where income / cash flow are now under pressure at the state
level. The economic recovery is but inching forward in the eurozone.
The revenue take of sovereigns is under pressure, and state
spending has been pushed higher to fund recession countermeasures
such as unemployment insurance. The problem is now being
compounded by sharply rising funding costs for Greece, Spain et al
as investors worry about debt service capability in the present
but down the road as well if greater austerity drags incomes further
down as a result of restructuring programs.
Sound thinker Edward Hugh holds forth on the subject for the
EU here.
Subscribe to:
Posts (Atom)