Measured yr/yr, real GDP increased by about 3.3% through Q2 '10.
Given that this 12 month period represents a full year of recovery,
this is a disappointing result. Partly, it reflects slower than expected
rebuilding of inventories in the wake of enormous inventory
liquidation during the recession. My coincident indicators -- real
wage change, total civilian employment, real retail sales and
industrial production -- were up 3.1% on a combined basis. One
factor that jumps out in looking at these indicators is how deeply
employment fell and also how the change in employment remains
negative still on a yr/yr basis. Safety net and stimulus programs
notwithstanding, the weak recovery of employment to date does
represent a serious loss of purchasing power in the economy.
The coincident indicators do not account for consumer savings
preference or for credit use. Consumers are rebuilding savings and
so far, credit use has been declining in the aggregate. So, collectively,
consumption has been on a cash and carry basis with occasional
dollops of funds squirreled into savings.
Real GDP when measured yr/yr should really be up between 5-6%
in the early stage of recovery and the shortfalls in consumer spending
and inventory re-investment are important factors behind the
lag in expected performance.
Long term, I peg real GDP growth potential for the US at 2.8% per
year. That is below the historic rate and reflects reduced
assumptions concerning labor force growth and labor participation
rates. It is far too early to reduce growth potential further, but it
is fair to acknowledge that the fist full year of recovery was a
disappointment. I can understand the fear and caution this
recession has created, particularly since it hit the work force,
household wealth, and the banking system so hard. For now, I am
trusting that continued recovery, however moderate, will allow
all major sectors to loosen up and behave with more confidence.
---------------------------------------------------------------
* I have many reservations about using GDP data, not the least
of which are the political ends it is used to serve. So I'll probably
only touch on it once a year or so.

Friday, July 30, 2010
Wednesday, July 28, 2010
Earnings & The Stock Market
The current cyclical recovery in corp. profits has been very powerful
so far. In history, it has only been matched by the massive jumps in
profits that occurred in the post WW1 economic recovery, the
surge off the Great Depression bottom in 1932, the immediate
post WW2 recovery and the great bounce after the 1937 recession.
The current surge in profits has exceeded most observers' initial
estimates by a country mile.
Grand surges in profits off depressed levels as recoveries begin can
last up to four years and fool more conservative expectations. It is
absolutely true that the exceptional earnings recovery over the past
year has been in part fueled by cost cutting, but yr/yr sales are up
about 9.5% by my count. The sales have provided the leverage
needed to produce the profit gains, and it is critical to note that
most companies have achieved recovering sales with just nominal
purchasing power. Plus, we can throw on about $200 bil. of loan
loss reserves that pared the total figure.
Let me stir the pot a little bit more. The bookend recessions of the
past decade have led to a large output gap between sales as booked
and sales that would have been booked under more normal trend
progress conditions. For SP 500 profits that "gap" is about $30 per
share or 42% of 12 months profits through July. History shows that
when a large output gap opens up in the wake of very poor economic
performance, only a portion of it is made back with the rest lost to
history. Even so, there is latent profits recovery of consequence in
store.
Most agree there is a slowdown of output growth ahead, and as I
discussed yesterday there is uncertainty over the likely progress of
liquidity growth needed to sustain economic recovery. When you
contrast this line of thought with the fact that profits have been
exploding upward, I think you will find a situation where without a
very sharp and extended slowdown in output growth, profits could
continue to run strong even if there is only a modest acceleration
in the growth of pricing power as economic recovery progresses.
And, you can see this tension playing out in the financial media.
Earnings are popping, but macro data suggests a slowdown ahead.
Now, even if profits growth goes ahead and moderates sharply, we
may well wind up with 12 month earning power for the Sp 500 at
decently high levels -- say $80 to 85 a share -- with much more
to come when the slowdown ends and the economy steps up some
in growth.
I guess if you pool today's post with yesterday's, what may shake out
is risk / uncertainty in the short run for stocks vs. the potential for
a big pay day if the economy regains moderate balance.
Ah, well, something to think about.
Tuesday, July 27, 2010
Stock Market -- Fundamentals
The Window Of Uncertainty
Core fundamentals remain positive but do not exhibit the strength
seen throughout 2009. This indicator has only two settings --
positive and negative. When the core is positive, monetary policy
is relaxed, confidence is high or improving and interest rates, both
short and long are in cyclical low zones. The signal goes negative
when the Fed actively tightens credit via raising short rates and
draining reserves and bond yields begin to rise on a cyclical basis.
Negative core fundamentals do not imply an end to a cyclical bull
market, as credit growth usually supports rising output and profits.
But a negative signal suggests investors should either raise some
cash and/or trade in the shorter run, as the "easy money" has been
made.
The window of uncertainty we are now encountering involves an
interval of unknown duration in which reliance of the economy
switches from monetary liquidity growth to private sector credit
to sustain recovery / expansion. Usually, this transition is seamless
and occurs early in the recovery cycle. It has not happened yet,
and the uncertainty is poignant because the Fed, having loaded the
system with monetary liquidity in 2009, has stopped adding on the
assumption private sector credit demand would grow and take up
the slack. The latter has yet to occur. The Fed is jawboning banks to
lend and Bernanke has promised to take steps to add liquidity in
the interim if the recovery falters. But, if this interim period is
mishandled, we could have a situation wherein the recovery fails
and a cyclical bear market develops even though core fundamentals
are "positive".
Such a failure would be unprecedented and, I suspect, it is still too
early to tell if a failure is other than a remote possibility. But, my
indicators show that a seamless transition from monetary to credit
driven growth has yet to occur, so the unpleasant possibility of a
serious screw-up needs to be flagged.
Investors are aware of this particular uncertainty issue. And, over
May and June, when my weekly cyclical pressure gauge took a
tumble, the market reacted in a strongly negative way. The
weekly pressure gauge has leveled off, and investors no doubt are
heartened by strong Q 2 '10 profits results and the Fed's pledge to
address the liquidity issue as needed (See the 6/15 post for more on
the pressure gauge).
Indications that economic and profits growth are going to be easing
along with the uncertainty inherent in present monetary / credit
policy have led the market to trade at a significant discount to fair
value despite the recent strong advance off the 07/02 low. My
Market Tracker has fair value for the SP 500 at 1215 based on
estimated 12 mos. net per share through July. The discount stands
at 8.2% now, and was even an even larger 15.8% in early July. The
Tracker is a cyclical measure. On my long term model, the market is
now well priced under 1155 for holding periods beyond three years.
If you are kind enough to be reading along still, I can tell you the US
has not seen a situation quite like this for a good 100 years, if not
longer. It could all be wrapped up tidily and positively in a month or
so, or it could drag on, in which case the best and time honored
indicators would fail to signal correctly what to do and would leave
us to fly by the seats of our pants. I remain positive but watchful.
Friday, July 23, 2010
Long Treasury Bond
The first try at a sustainable cyclical run-up in yield started in Half 2
2009. It was aborted in recent months as cycle growth measures and
inflation pressures eased, thus postponing any move by the Fed to
tighten credit overtly via raising benchmark short rates. The recent
downdraft in the bond's yield conforms perfectly with my monthly
broad macro economic yield indicator(data through June). Now, the
weekly cyclical pressure gauges I follow have started to level out
after falling sharply over May and most of June. This suggests the
long Treasury yield may stabilize around 4.0% as players assess
whether the weekly data could be signaling that the economy is set
to show more stability (See chart which compares the $TYX with
GS's industrial metals index.)
The long guy's yield is well inside its 40 wk m/a. This indicates an
overbought condition. My long term technical and fundamental
indicators also suggest the bond is currently overbought. Trader
advisories are also moving into the "too bullish" camp.
Fed chair Bernanke says the economic outlook is "unusually
uncertain" right ahead, so it is doubtful the Fed is going to
get fired up to raise short rates soon. However, the bond market
can easily trade plus or minus 50 basis points as players read
the weekly economic tea leaves over July and August.
Thursday, July 22, 2010
Cyclicals -- Relative Strength Measure
Cyclicals have just barely matched the market this year, but
the relative strength line(RSL) for the group has been holding
support and does not yet indicate that investors are ready
to go along with the "double dip" economic scenario. For
that, I think we would need a sharp break down in the RSL
for the group. Chart
the relative strength line(RSL) for the group has been holding
support and does not yet indicate that investors are ready
to go along with the "double dip" economic scenario. For
that, I think we would need a sharp break down in the RSL
for the group. Chart
Economic Free Fall -- Some After Effects
First, A Little History
When the Great Depression kicked off in 1929, US industrial
output plunged, falling by nearly 53% until mid-1932. As 1932
commenced, the Fed finally began injecting liquidity heavily into
the system. By Half 2 1932, production started to rebound and
rose by 62% over the next 12 months. It was difficult to balance
supply and demand within the economy with such long range
volatility, and not surprisingly, production fell by 20% over Half 2
1933, before enough balance was restored to enable the economy
to begin to recover more smoothly.
Economic Free Fall: Mid 2008 - Early 2009
My best guess is that we had experienced a mini replay of the
Depression over the 2008-09 period. From its 06/08 peak of
350.0, my index of the $value of US production plunged 15.7% to
a cyclical low of 295.0 in 04/09, before it recovered 9.4% to 322.8
in 06/10. By, post WW2 standards, this action reflects phenomenal
volatility, and I suspect it has proven difficult for households,
businesses and banks to adjust to it. Thus, we see a recovery in
retail sales, along with the paydown/liquidation of consumer
debt and an effort to boost personal savings. We see businesses
re-tooling equipment but only very reluctantly hiring. And then,
there are the banks. They stuffed loans in your pockets in 2005-06,
but now they are reluctant to lend to top quality smaller credits.
Mentality Not On Fast Forward
The economy has moved ahead, but many folks have yet to catch
up with it. Economic free fall and an initial quick bounce happened
so fast that restoring and maintaining balance and perspective have
been difficult to accomplish.
Something Not So Nice Is Ahead
Since the end of April, the weekly leading economic indicator sets
I use have declined sharply. Both have stabilized a bit in July, but
the damage has been heavy enough to signal that an economic
slowdown of some meaningful proportion lies ahead. The ECRI
WLI*, now watched very closely by throngs, has experienced a
two month decline that is consistent with development of an
economic recession. This index went into free fall from mid-2008
until early 2009, and then experienced its fastest rebound ever.
In fact, it rose by more than it normally rises in the first two
years after a recession and the decline it has experienced since the
end of April brings it down to a level consistent with a 12-14 month
timeline of recovery from a substantial recession.
Most of the classical elements which presage a recession are not
in place. What we do have are confidence levels across the spectrum
that are so low, that if folks do "freeze up" -- do not spend, do not
lend and do not hire, we could be in the soup.
Now I follow a very simple maxim: The money gets spent in the
USA. The Fed has added prodigiously to the basic money supply.
"Pushing on a string" is not an American economic concept. I think
we move forward with recovery, but its resumption could await
restoration of more of a sense of balance among the players and a
boost to confidence, which incidentally, can turn on a dime.
Now, in the next couple of months, we need to see folks loosen up
a little and get with the program. Such does not mean return of
prodigality but a balanced response to a recovering environment.
...................................................................................................................
* ECRI website.
Monday, July 19, 2010
Gold -- Interesting Period Ahead
Back on 6/27, with gold at $1256 oz., I posted that the metal was
riskier in price on several measures, including the fact that my gold
macro-directional indicator had diverged negatively from the price of
gold. I mentioned $60 oz. of near term price risk. Well, we closed the
day at $1183. A considerable portion of the overbought has been
removed, but, as the linked -to chart below shows, we have two
month downtrends on RSI and MACD, and a wave theorist might
argue that gold has completed a five wave up move with a recent
top that was fatigued on a momentum basis.
The fun element here is that since gold began its latest uptrend in late
2008, the bugs have come in to buy all of the dips between 30 -40
on RSI. RSI on today's close is 40, so it will be interesting to see if
the bugs are set to launch a rescue effort and rally the stuff. A
significant break of trend, and gold is close to it, could be on the
nasty side if the gold buffs sit this one out.
Gold chart.
Friday, July 16, 2010
Inflation Situation
The CPI hit an all-time peak of 220.0 in 07/08. With recession in
full flower, it fell to an interim low of 210.2 in 12/08. The CPI has
recovered most of the decline since, but stands now at 218.0 for
June. Thus, technically, the US is still in deflation and more so
when you view asset deflation such as losses in home values and the
SP 500 over recent years.
From the interim low of 210.2 set 12/08, the CPI recovered by 3.7%
through 04/10, but has flattened out recently on weakness in the
commodities market and a continuing deceleration of the CPI
excluding food and fuels. The inflation pressure gauges I use did
peak over the Mar. / Apr. period and remain sluggish. My longer
term pressure gauge, which was signaling a sharp rise of inflation
in 2011, has moderated very substantially since the spring of 2010.
One key gauge of inflation potential, the capacity utilization rate,
stands at 74.1%, which is very low for the post WW2 period, and
is well below the the 80% level, when pricing pressures tend to pop.
Prospects for a moderation in the growth of China's manufacturing
output has put a chill on commodities prices, and is proving
beneficial to the US on the inflation front.
Measured yr/yr, the CPI was up by 1.1% through 06/10, and it
may well stay subdued until positive interest returns to the
commodities market. Commodities composites have bounced a bit in
recent weeks, but have yet to challenge a mild downtrend now in
place. CRB chart. When looking at inflation potential, you need to
watch commodities and oil in particular like a hawk.
The supply / demand equation for petroleum products and for
industrial commodities has tightened appreciably over the past
decade in comparison to the 1980s - 1990s. With Asia (ex. Japan)
and South America now sporting more vibrant economies, I have
developed a GDP weighted global total economic supply/ demand
pressure gauge. It has recovered substantially from its recession
low in early 2009, but at a current reading of 132.0 is well below
the 140 - 145 range that would suggest global inflation pressure
and an intense run-up in petroleum and industrial commodities
that could force sharp synchronous credit tightening by major
central banks. We are still in a "cool zone" now. One lesson from
the global gauge is that the US can experience cyclical inflation
pressure if the world is running hotter but the US is still running
well below effective capacity.
Wednesday, July 14, 2010
Financial Liquidity & Banking System
Liquidity
There has been little change in my broad credit-driven measure of
financial liquidity in months. On balance, private sector credit
demand has remained lax, so banks have done little to create or
compete for the deposits that would touch off faster broad liquidity
growth. Interestingly, the Fed did ease along with monetary
liquidity in June, which it will need to continue to do if private sector
credit demand does not recover. The Fed is looking at its options in
this regard.
The Fed's outreach programs show that some bankers are reluctant
to lend to smaller businesses with strong cash flows because of
concern over collateral values and is indicating to banks that healthy
debt service capability should receive more priority. It is also clear
that even though FICO credit scores for households have slipped only
slightly over the past two years, banks are employing more stringent
standards in extending consumer credit. So, even though credit
demand has been modest in this economic recovery to date, it is
becoming more clear that bankers are also maintaining conservative
practices adopted in the immediate wake of the financial crisis. This is
a natural development given the grand magnitude of loan losses the
banks have piled up over the past two years, but at some point
before too long, they are going need to loosen up a little, especially
with regard to business credit.
Banking System
As is typical of recession / post recession periods, the banks have
been letting the total system loan / lease book run off. On a revised
basis the run off has been roughly $600 bil. or 6.2%. Even so, the
L&L book remains about $400 bil. over the long term trend as the
banks bring the book slowly into line with trend. By the same token,
banks have substantially increased their investment portfolios, and
my flash liquidity indicator (Treasuries vs. shorter term business
loans) has shown marked improvement. Bank capital has been
growing, and loan loss reserves have recently shown more stability.
It was also good to see that both consumer loans and commercial &
industrial loans showed stability in June, after lengthy declines. The
banks have a considerable way to go to get back into long term
balance, but there has been enough improvement to enable them to
participate in the economic recovery in a moderate way.
Sunday, July 11, 2010
OEX 100 Put / Call Ratio
The OEX 100 (big caps) was an early entrant in the index option
derby and was probably one of the most popular for a number of
years. Normally, the OEX put / call ratio exceeds 1.00 as larger
players use puts to hedge long equity positions, either as a genaral
strategy or for OEX baskets held long. It is unusual to see the
put / call ratio below 1.00 because the players are then net long
and unhedged in total. Having traded OEX options for so many
years, I keep an eye on the P/C ratio if only for old time's sake.
The ratio went below 1.00 with some consistency toward the end
of 2008 and stayed low well into the early part of 2009. Partly,
this no doubt reflected the rising cost of options and the fact that
long OEX baskets had been sold out, but I also concluded the
bigger players believed the bear market was ending. We have a
similar situation today, and again, I have concluded that the bulk
of the corrective action may have been taken.
I also watch the OEX P/C ratio against the CBOE individual
equities P/C ratio. I have noticed that there are cases when the
OEX P/C is a whopping 1.5 and the CBOE is just .50. More
often than not, the OEX put buyers have been right and the
market is toppy. So too when the OEX is below 1.00 and the
CBOE is slightly elevated, say above .60. The market at these
times is more likely to be sold out.
This type of comparison does not work all the time, and it
requires a bit of a guess as to when to pay attention to it. But,
I have to say I am usually comfortable with comparisons of
this sort.
OEX put / call ratio chart. (Two looks).
Saturday, July 10, 2010
Stock Market --Technical
The SP 500 popped up enough last week to set up a challenge of the
downtrend in force over the past two months. For trend followers,
there is promise but no confirmation of a positive reversal, either
short or intermediate term. In fact, 13-14 wk indicators are still
negative.
We have had three legs down on this correction, so the challenge
of the downtrend line ahead may be more forceful. I must say,
however, that I very much dislike seeing a week end with a challenge
in view only to see it be postponed. That will prompt some trend line
traders to have reservations.
My NYSE buying pressure index has not broken down, and the
selling pressure index has failed to sustain a rise. When I look at
advances vs. declines on a rolling six wk. basis, there is net
accumulation underway, but there is nothing smooth about it. As
the chart link below shows, the cumulative NYSE adv / dec line
has held support well, has broken through its downtrend line and
is just turning positive on MACD. I am also heartened by the
dramatic improvement in the TRIN last week following an
extended interval of capitulation.
In short, the market is getting close, but has yet to earn the cigar
in the near term.
NYSE A /D chart.
Friday, July 09, 2010
Consumer Credit
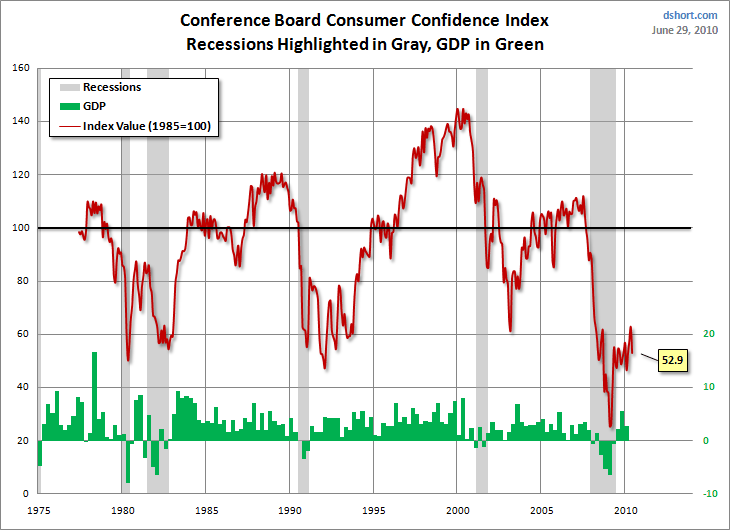
Consumer credit -- excluding mortgages -- declined again May, and
it is down about 7% from the peak of nearly $2.6 tril. in 2008. This
no doubt reflects the severe decline and only partial recovery of
retail sales over the period, but It is also probably an outcome to be
expected given the extraordinary plummet in consumer confidence
as well. Confidence has recovered modestly over the past year, but
it is just coming up to the lows registered after prior economic
declines. Chart.
The chart does show an extended period of low confidence in the
early 1990s. Back then, the housing market was also weak, and there
was a surge in so-called white collar layoffs not seen before in the
post WW 2 era over the same interval. Noteworthy is that total
consumer credit was flat over most of the 1990 - 93 period before
recovering.
I am reluctant to say we have entered a "new normal" era of
consumer deleveraging or credit use austerity, as it seems that the
round of revolving credit paydown / default we have witnessed in
this cycle reflects the depth of the recession and the pounding
consumer confidence has taken -- weaker home prices, damaged
retirement savings, a depressed job market. I think it is too early
in the game to posit a new era of austerity and that we need to
first see how confidence responds to continued economic recovery.
Wednesday, July 07, 2010
Stock Market Psychology
The market has been doggedly following short term economic
factors, particularly the ECRI leading index, weekly unemployment
claims, sensitive materials prices and the 2 yr. Treas. note yield.
At first, I thought strength so far this week might reflect other
positive economic signs such as a large increase in global chip sales
and indications retail store sales were pretty decent in June. Then,
I checked in with "Dr. Copper", one of the better economic
forecasters around, only to find that the copper price has started to
edge up in recent days. Since copper is one of the more important
of the group of industrial commodities, action in this market may
be receiving unusually heavy scrutiny by stock traders. This would
also suggest that the market might still be retaining its narrow
short term focus on near-in fundamentals. Copper.
Monday, July 05, 2010
Stock Market -- Technical
1) The market is moderately oversold on a price momentum basis
for the short term, and it is closing in on exhaustion of the sell-off.
NYSE breadth has held up better than has price momentum, and
the market is not oversold but is neutral on these measures. My
breadth indicators, when oversold, are more reliable than the
price momentum measures. The SP 500 closed out last week at
1023. Next support level is 1000.
2) My biggest technical concern during the nearly 13 month long
80% leg-up in the market off the 03/09 low was that the angle of
the trajectory was simply too steep and that at some point investors
would be faced with an extended consolidation / sell-off interval
before there could be another durable up-move. Much, but not all
of that risk, has been removed over the past couple of months.
3) For many years, I have used a price oscillator determined weekly
off the 40 wk m/a. Toward the end of 2009, that oscillator (the
premium / discount in price off the 40 wk m/a) reached extended
levels not seen since the bubble years of 1997 - 99. Now, the market
has swung to a discount steep enough to be consistent with a
developing bear market. The current reading is neutral between
whether a cyclical bear is in force or whether we face a steep price
correction in an ongoing cyclical bull (a kind of "economic slowdown
shock"). Since the volatility in the market (and in the economy) has
been so great over the past two years, I think it is simply premature
to call a cyclical bear, and I am remaining in the bull camp for now.
Strategy
As discussed last week, I am presently long the market. But, I
envision running a personal hedge fund primarily using options
to hedge my position in various ways until we see a diminution in
economic volatility which I freely concede might not occur until
another 12 months has gone bye the bye. (I have traded call and
put options since the mid-1970s. Such trading can be a vexing
and frustrating affair, particularly as regards order execution. I
enjoy it overall, but such trading is not for everyone. Practice first
for an extended period before you try for real.)
I have linked to a weekly chart for the SP 500 which suggests the
market may also be close to an exhaustion of the recent sell-off.
Chart.
Friday, July 02, 2010
Economic & Profits Indicators
Weekly leading indicators have recently stabilized after a
sudden and wrenching downturn running through May and mid-
June. But there has been an unmistakable signal that slowing
of recovery progress lies ahead. Monthly leading indicators also
signal a slowdown, but have held up better than the weeklies. The
recovery surge in the monthly indicators from early 2009 was not
exceptional at all, while the lift off in the weeklies was the strongest
in the modern era. When the weeklies such as the ECRI set are
viewed in the context of the first 24 months of recovery, the recent
weakness brings them down to average from super-strong. the
weeklies in the US line up best with the powerful recovery of
export sales and factory orders and less so compared to the broader
economy.
My economic power index, which focuses on the real wage and
the change of total employment, has been slow to recover. The
real wage, measured yr/yr is flat. This reflects weak labor market
conditions, but it also continues a trend of business to not reward
labor for productivity improvement but to let rewards flow entirely
to capital instead. Investors applaud the practice on an individual
company level, but, when seen in the aggregate, it undermines the
purchasing power of the economy and leads to a reduction in the
efficiency of $ capital. The index results also show companies have
been slow to rehire, preferring to "milk" current operations as
fully as possible. The salutary here for workers is that real take
home pay is up 1.6% yr/yr entirely as a result of more hours
worked plus OT.
The slow recovery of the EPI coupled with wage earner attempts
to replenish savings and avoid dipping into credit has created an
environment that supports modest and not robust economic
progress.
Profits indicators were very strong through the first five
months of 2010, but they did moderate in June, and the leading
indicators now suggest further moderation as the year progresses.
My long term leading economic indicators were the
strongest ever at the end of 2008. The indicators have lost
strength since then but remain positive and continue to support
economic and profits recovery through 2011. However, I am
concerned that the Fed not be asleep at the switch and that It
will be prepared to provide additional monetary liquidity to the
system if private sector credit demand -- now basing -- does not
show decent lift by this year's end.
Subscribe to:
Posts (Atom)