Back in late Jul. / mid Aug. of last year, I argued that the long Treas., then trading in the mid 130s,
was nearly a perfect short, and that there could be a surprisingly steep decline in the bond back
down to important support around 115. The bond was strongly overbought, sentiment was on the
bullish side, and most importantly, previously positive short term fundamentals were just starting
to reverse to the negative side. Since, the bond fell to about 117, an oversold level, and there are
now far more bears than bulls among advisory services. Moreover, the strong positive momentum
in retails sales, production and industrial commodities prices that have sustained the decline in
the bond's price may well decelerate some at some point in the months ahead. The long Treas.
may not be a nearly perfect long at this point, but it is on my radar as a long side trade, especially
if it were to trade down to 115 support and then bounce. I will be paying special attention to the
broad industrial commodities spot price composites. The Journal of Commerce - ECRI index is
up 25.5% since mid Jul. 2010, and could well experience sufficient seasonal weakness during
Q2 '11 to generate a nice interim rally in the bond. (long Treas. price chart).
The long Treas. yield has been constrained in recent years by the Fed's ZIRP on short term rates
and a modest rate of increase in the CPI since a deflationary cyclical low at the end of 2008.
Volatility in the bond yield has primarily reflected the shorter term momentum swings in the
pace of economic recovery, especially industrial production and commodities prices. So far
in the current recovery, the bond's yield has hit resistance up around the 4.80% level ($TYX).
Looking longer term, the bond is flirting with breaking through a multi year downtrend line at
present. However, I would take this development as no more than a very preliminary indication
that the downtrend in the bond yield could finally be ending. The case would get more interesting
if the yield on the long Treas. was to rise from the current 4.60 - 4.80% level up to and finally
through longer term resistance in the 5.20 - 5.50% level. This development would likely
occur on a cyclical tightening of monetary policy including boosts to the Fed Funds %. With
continuing economic recovery, the US could be a lot closer to that point by late 2011 provided
the recovery in private sector credit demand is well underway. We have yet to see that
recovery.

Tuesday, February 15, 2011


Saturday, February 12, 2011
Financial System Liquidity
The banking system has backpedaled further as we move through early 2011. Not only is the
system experiencing a continuing run off of its loan book, we are now seeing a run off develop
in the system's securities portfolio as banks back away from extended maturities as interest
rates rise. On the monetary front, the Fed's program to buy Treasuries has recently been the only
game in town. Since folks have been waiting to see the banks expand their loan portfolios, it is
neatly ironic that securities holdings have started to run down as well.
A shrinking system balance sheet naturally reduces banking net revenues. To compensate, banks
are raising service fees whenever and wherever they can, and are also allowing the massive
loan loss reserve to run down in a gradual manner. And, of course, the bigger banks are generating
some profits from trading economically dubious derivatives.
Americans love irony, and the banks have been a continuing source of same. In 2005, any Tom
Dick or Harry could get a loan. Now, a half dozen years later, only Rockefellers need apply.
system experiencing a continuing run off of its loan book, we are now seeing a run off develop
in the system's securities portfolio as banks back away from extended maturities as interest
rates rise. On the monetary front, the Fed's program to buy Treasuries has recently been the only
game in town. Since folks have been waiting to see the banks expand their loan portfolios, it is
neatly ironic that securities holdings have started to run down as well.
A shrinking system balance sheet naturally reduces banking net revenues. To compensate, banks
are raising service fees whenever and wherever they can, and are also allowing the massive
loan loss reserve to run down in a gradual manner. And, of course, the bigger banks are generating
some profits from trading economically dubious derivatives.
Americans love irony, and the banks have been a continuing source of same. In 2005, any Tom
Dick or Harry could get a loan. Now, a half dozen years later, only Rockefellers need apply.
Friday, February 11, 2011
US Inflation -- Some Additional Thoughts
As most of you know, the US has been in a period of decelerating inflation for over 30 years now.
In fact, the US economy has become increasingly deflation prone reflecting the steep deceleration
of the CPI composite which excludes volatile fuel and food prices.
The deceleration of inflation pressure has unfolded despite occasional bouts of strong money and
credit growth.
My broad measure of money growth to include the major sources of credit funding has been on the
flat side for nearly three years. Money M-2 has increased by 16.6% over this period. But this was
offset by a substantial decline of large or "jumbo" bank deposits and the collapse of the important
commercial paper market. Since the very broad measure of money growth has been contracting
since late 2008, the Fed has been forced to buy $1.5 tril. of securities to maintain liquidity in the
system. The raw material for sustained higher inflation in the future has increased by zilch overall
over the past three years.
It is normal for commodities prices and for the CPI to accelerate up during economic recovery /
expansion periods. The pressures can be intense, but when the expansion period tops out, the
reversal to weakness in commodities prices and deceleration of the broader measures of inflation
can also be strong. Looking out 5-6 years, it takes no stretch of the imagination to envision a
cyclical peak of 5% for the CPI measured yr/yr to be followed by a return to mild price
deflation when the economic cycle heads into another downturn.
For the US, it is true that inflations of consequence start in the commodities pits and especially
so if it is fuels prices that lead the way. Over the past 30 years, the supply / demand profiles for
fuels, industrial commodities and other raw materials have seen a shift away from excess supply
to much greater balance reflecting underinvestment and a broadening of rising demands from
the faster growing emerging economies such as China. Longer term, the potential for higher
inflation in the US has increased on supply / demand grounds. Even so, It takes a series of
economic and policy circumstances playing out over an extended period of time to generate a
sustainable acceleration of peacetime inflation.
There is no shortage of debate on the web over whether inflation or deflation will prevail in
the years ahead. My position is that the marked increase in the tendency toward deflation must
first be arrested, and that if it is, there will be many hurdles to overcome if inflation pressure
is to take hold and sustain in a longer run uptrend in the years ahead.
In fact, the US economy has become increasingly deflation prone reflecting the steep deceleration
of the CPI composite which excludes volatile fuel and food prices.
The deceleration of inflation pressure has unfolded despite occasional bouts of strong money and
credit growth.
My broad measure of money growth to include the major sources of credit funding has been on the
flat side for nearly three years. Money M-2 has increased by 16.6% over this period. But this was
offset by a substantial decline of large or "jumbo" bank deposits and the collapse of the important
commercial paper market. Since the very broad measure of money growth has been contracting
since late 2008, the Fed has been forced to buy $1.5 tril. of securities to maintain liquidity in the
system. The raw material for sustained higher inflation in the future has increased by zilch overall
over the past three years.
It is normal for commodities prices and for the CPI to accelerate up during economic recovery /
expansion periods. The pressures can be intense, but when the expansion period tops out, the
reversal to weakness in commodities prices and deceleration of the broader measures of inflation
can also be strong. Looking out 5-6 years, it takes no stretch of the imagination to envision a
cyclical peak of 5% for the CPI measured yr/yr to be followed by a return to mild price
deflation when the economic cycle heads into another downturn.
For the US, it is true that inflations of consequence start in the commodities pits and especially
so if it is fuels prices that lead the way. Over the past 30 years, the supply / demand profiles for
fuels, industrial commodities and other raw materials have seen a shift away from excess supply
to much greater balance reflecting underinvestment and a broadening of rising demands from
the faster growing emerging economies such as China. Longer term, the potential for higher
inflation in the US has increased on supply / demand grounds. Even so, It takes a series of
economic and policy circumstances playing out over an extended period of time to generate a
sustainable acceleration of peacetime inflation.
There is no shortage of debate on the web over whether inflation or deflation will prevail in
the years ahead. My position is that the marked increase in the tendency toward deflation must
first be arrested, and that if it is, there will be many hurdles to overcome if inflation pressure
is to take hold and sustain in a longer run uptrend in the years ahead.
Tuesday, February 08, 2011
China Downsizes The Monetary Dragon
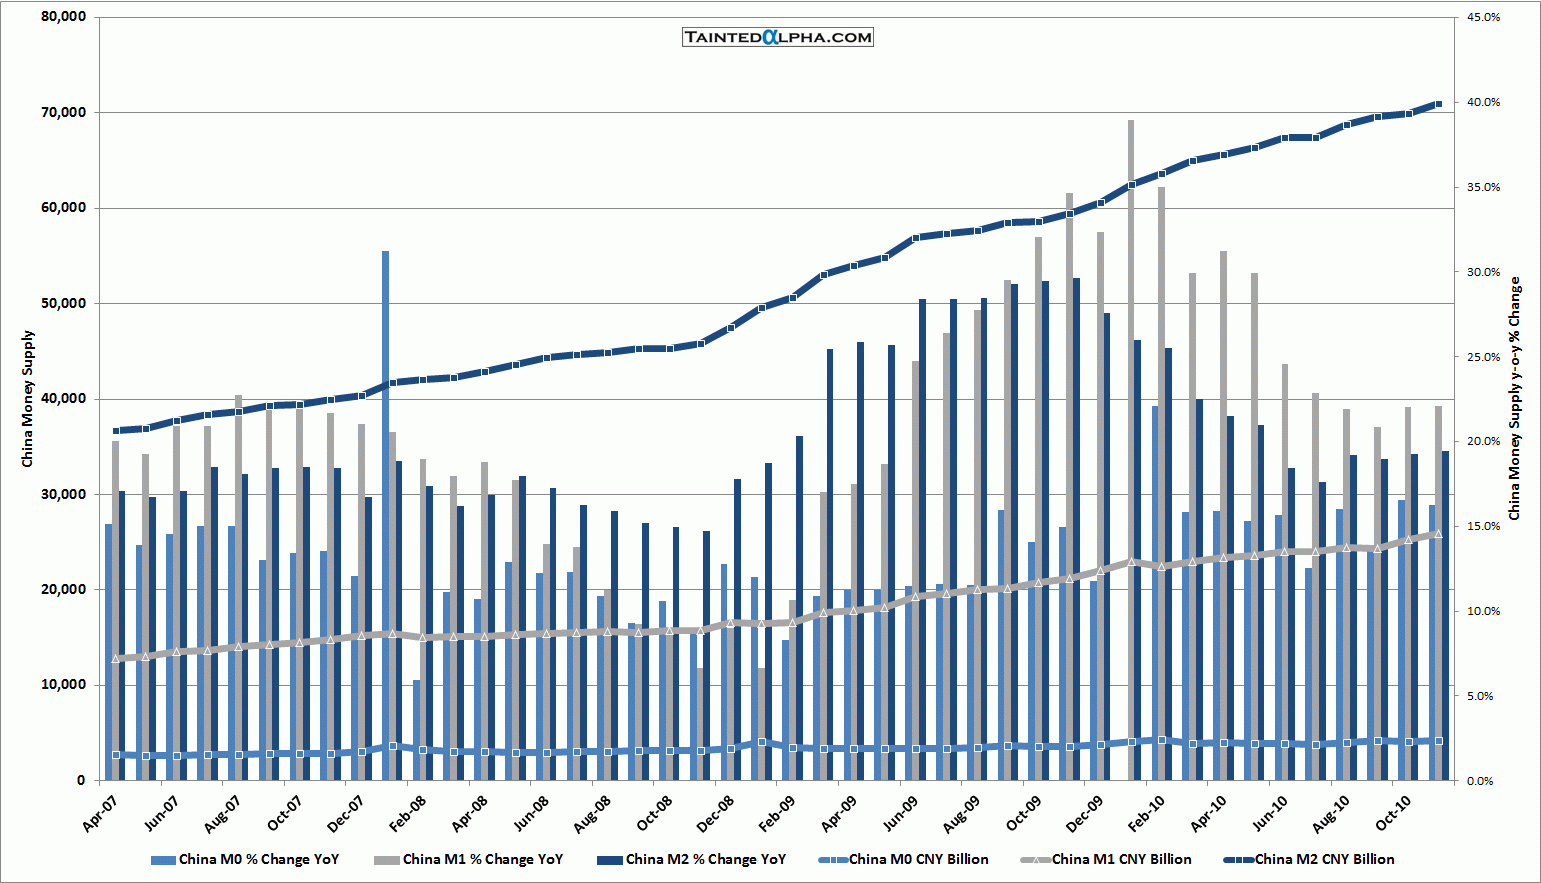
At the height of Its fiscal / monetary stimulus push in 2009, China's broad money growth (M-2)
reached a staggering 29% measured yr/yr. That dubious milestone nearly co-incided with the
post bubble peak of its stock market.
If we hold money velocity flat, nearly 30% money growth in a 10% real growth economy equates
to inflation potential of nearly 20% per annum. Through successive tightenings of monetary and
credit policies, the Chinese have winnowed the growth of M-2 down to 20% yr/yr through year
end 2010. That still leaves inflation potential of 10%. In practice, as China has re-accelerated its
real growth from the 2008 lull, the velocity of money has declined, with the excess liquidity going
primarily into inflating its real estate market. China is running a CPI of 5%, with many observers
claiming the CPI is underreported and is really more like 7.5%.
I think it is likely China will have to continue to tighten until its broad money supply declines to
15% yr/yr and inflation potential is brought down to 5% or less. So, at some point, since the
demands of the real economy eclipses money flow into the property and capital markets, China
could well experience price contraction in its property and capital markets, with the bloated
real estate sector the likely big loser. China money growth chart.
China's stock market has basically gone nowhere since the spring of 2009. There has been money
flow rotation into the real estate markets, and the strong earnings generated by corporate China
has been offset by a p/e ratio contraction stemming from rising inflation and interest rates which
push up the hurdle rate for new flows into equities. (Shanghai Composite)
Since 2012 is a year in which the top China leadership exits and the new guys come on board,
one could, if one used US politics as a guide, argue that Hu and Wen will want to go out strong
and leave the remaing mess for the new dudes to clean up. However, I am guessing that The
Party might take a dim view of such proceedings, and that Hu and Wen may be left to soldier
on by further bringing money and credit under reasonable control so that the fresh guys do not
face an immediate fire drill (no puns intended).
So, I come out the door saying that the stock market may well be strong next year, and that
a good entry point may come later this year. The MACD intermediate term trend on the chart
link above suggests the market may be rolling down into a somewhat deeper short term correction.
If such occurs, the situation could get interesting down the road.
reached a staggering 29% measured yr/yr. That dubious milestone nearly co-incided with the
post bubble peak of its stock market.
If we hold money velocity flat, nearly 30% money growth in a 10% real growth economy equates
to inflation potential of nearly 20% per annum. Through successive tightenings of monetary and
credit policies, the Chinese have winnowed the growth of M-2 down to 20% yr/yr through year
end 2010. That still leaves inflation potential of 10%. In practice, as China has re-accelerated its
real growth from the 2008 lull, the velocity of money has declined, with the excess liquidity going
primarily into inflating its real estate market. China is running a CPI of 5%, with many observers
claiming the CPI is underreported and is really more like 7.5%.
I think it is likely China will have to continue to tighten until its broad money supply declines to
15% yr/yr and inflation potential is brought down to 5% or less. So, at some point, since the
demands of the real economy eclipses money flow into the property and capital markets, China
could well experience price contraction in its property and capital markets, with the bloated
real estate sector the likely big loser. China money growth chart.
China's stock market has basically gone nowhere since the spring of 2009. There has been money
flow rotation into the real estate markets, and the strong earnings generated by corporate China
has been offset by a p/e ratio contraction stemming from rising inflation and interest rates which
push up the hurdle rate for new flows into equities. (Shanghai Composite)
Since 2012 is a year in which the top China leadership exits and the new guys come on board,
one could, if one used US politics as a guide, argue that Hu and Wen will want to go out strong
and leave the remaing mess for the new dudes to clean up. However, I am guessing that The
Party might take a dim view of such proceedings, and that Hu and Wen may be left to soldier
on by further bringing money and credit under reasonable control so that the fresh guys do not
face an immediate fire drill (no puns intended).
So, I come out the door saying that the stock market may well be strong next year, and that
a good entry point may come later this year. The MACD intermediate term trend on the chart
link above suggests the market may be rolling down into a somewhat deeper short term correction.
If such occurs, the situation could get interesting down the road.
Monday, February 07, 2011
Inflation Potential
In the US, the CPI reached an all-time high of 220.0 in 7/08. With the rapid descent of the
economy over Half 2 '08, deflation pressure set in and the CPI fell to 210.2 in 12/08. The
inflation index has been recovering since then, and it should eclipse the prior record 220.0
level relatively soon.
Since the end of 2008, the CPI has recovered by about 2.2% per year. There has been a sharp
cyclical rise of commodities prices, including in the important fuels and foods categories, but
The CPI, exluding the volatile food and fuel sectors, has decelerated persistently since late 2006,
and recently has been increasing at only an 0.8% rate yr/yr.
It can take up to two years from the time the leading economic indicators bottom and start to
recover until the large and less volatile component of the CPI begins to accelerate to the upside.
Since the leading indicators bottomed in early 2009, the large inflation component which
excludes foods and fuels should begin to accelerate in Half '1 2011. This development, coupled
with a volatile, ongoing cyclical rise in commodities prices, could push the yr/yr CPI to 2.5%
by year's end 2011 and upward to 3.0% on a yr/yr basis by mid-2011. Because of the powerful
volatility of commodities prices, these projections have to be seen as being in the "back of the
envelope" style -- conjecture with a degree of sophistication.
The inflation pressure gauges I use are now trending higher. These measures give heavy weight
both to commodities prices and factory operating rates and both suggest an acceleration of the
CPI from the late '10 1.5% yr/yr level up to 2.0 - 2.5% in the months ahead. It is interesting to note
that when the pressure gauges have eased off as occurred in Half '1 2010, the upward thrust
of the CPI has tailed off rapidly. Such will be less likely once the the broader, less volatile
component of the CPI starts a period of cyclical acceleration.
economy over Half 2 '08, deflation pressure set in and the CPI fell to 210.2 in 12/08. The
inflation index has been recovering since then, and it should eclipse the prior record 220.0
level relatively soon.
Since the end of 2008, the CPI has recovered by about 2.2% per year. There has been a sharp
cyclical rise of commodities prices, including in the important fuels and foods categories, but
The CPI, exluding the volatile food and fuel sectors, has decelerated persistently since late 2006,
and recently has been increasing at only an 0.8% rate yr/yr.
It can take up to two years from the time the leading economic indicators bottom and start to
recover until the large and less volatile component of the CPI begins to accelerate to the upside.
Since the leading indicators bottomed in early 2009, the large inflation component which
excludes foods and fuels should begin to accelerate in Half '1 2011. This development, coupled
with a volatile, ongoing cyclical rise in commodities prices, could push the yr/yr CPI to 2.5%
by year's end 2011 and upward to 3.0% on a yr/yr basis by mid-2011. Because of the powerful
volatility of commodities prices, these projections have to be seen as being in the "back of the
envelope" style -- conjecture with a degree of sophistication.
The inflation pressure gauges I use are now trending higher. These measures give heavy weight
both to commodities prices and factory operating rates and both suggest an acceleration of the
CPI from the late '10 1.5% yr/yr level up to 2.0 - 2.5% in the months ahead. It is interesting to note
that when the pressure gauges have eased off as occurred in Half '1 2010, the upward thrust
of the CPI has tailed off rapidly. Such will be less likely once the the broader, less volatile
component of the CPI starts a period of cyclical acceleration.
Saturday, February 05, 2011
Economic Indicators
The weekly leading activity indicators remain in solid uptrends but momentum has cooled
very recently reflecting some volatility in unemployment insurance claims and in industrial
commodities prices. The monthly leading data show a very sharp acceleration in the breadth
of new orders over the past three months. The US economy is off to a firm start in 2011, although
the recent strong momentum of retail sales may cool as the quarter progresses.
My economic power index -- yr/yr% in real hourly earnings + yr/yr % in total civilian employment --
remains a paltry 1.3% before adjustment. When I add in $ of extra hours worked and the 2%
cut in payroll taxes, the EPI rises to 3.6%, which is a solid enough reading as long as you
remember that one cannot simply count on an extension of a lower payroll tax after 2011.
Civilian employment, which tends to lead the payroll data, has increased by more than 200K
in each of the past two months following an extended flat period. Should the civilian data
accelerate to the 240K per month level in the months ahead, we would have an encouraging
sign that employment growth was returning to a more nearly normal level for this stage of the
economic upturn.
The Fed has added over $40 bil. to the total of Fed Bank Credit over the past week or so. The
Fed is still running behind on a straight line projection of the QE 2 $600 bil. package, but it
is encouraging that the Fed has stopped dithering and has resumed the program. I continue to
recommend that They pick up the pace of Treasuries purchases.
very recently reflecting some volatility in unemployment insurance claims and in industrial
commodities prices. The monthly leading data show a very sharp acceleration in the breadth
of new orders over the past three months. The US economy is off to a firm start in 2011, although
the recent strong momentum of retail sales may cool as the quarter progresses.
My economic power index -- yr/yr% in real hourly earnings + yr/yr % in total civilian employment --
remains a paltry 1.3% before adjustment. When I add in $ of extra hours worked and the 2%
cut in payroll taxes, the EPI rises to 3.6%, which is a solid enough reading as long as you
remember that one cannot simply count on an extension of a lower payroll tax after 2011.
Civilian employment, which tends to lead the payroll data, has increased by more than 200K
in each of the past two months following an extended flat period. Should the civilian data
accelerate to the 240K per month level in the months ahead, we would have an encouraging
sign that employment growth was returning to a more nearly normal level for this stage of the
economic upturn.
The Fed has added over $40 bil. to the total of Fed Bank Credit over the past week or so. The
Fed is still running behind on a straight line projection of the QE 2 $600 bil. package, but it
is encouraging that the Fed has stopped dithering and has resumed the program. I continue to
recommend that They pick up the pace of Treasuries purchases.
Wednesday, February 02, 2011
Stock Market -- Technical
The market is continuing the second upleg of a cyclical bull which commenced 3/09.
The SP 500 is at best only mildly overbought short term. It is significantly overbought on an
intermediate term basis at a 12.7% premium to the 200 day m/a.
Over 90% of "500" stocks are trading above their respective 200 day m/a's. In a cyclical
upleg such as now, the 90% ratio can continue for an extended period of time. Confidence/
complacency as measured inversely by the VIX volatility index is at a cycle-so-far low of
17.3 The chart below shows that when the % above 200 day m/a for the composite ($SPXA200R)
is quite high relative to a cyclically low VIX, you need to pay extra attention because it can
signify that an extended rally is growing ever more mature, in that increasing confidence is
well reflected in the price action of the market. Chart.
The SP 500 is at best only mildly overbought short term. It is significantly overbought on an
intermediate term basis at a 12.7% premium to the 200 day m/a.
Over 90% of "500" stocks are trading above their respective 200 day m/a's. In a cyclical
upleg such as now, the 90% ratio can continue for an extended period of time. Confidence/
complacency as measured inversely by the VIX volatility index is at a cycle-so-far low of
17.3 The chart below shows that when the % above 200 day m/a for the composite ($SPXA200R)
is quite high relative to a cyclically low VIX, you need to pay extra attention because it can
signify that an extended rally is growing ever more mature, in that increasing confidence is
well reflected in the price action of the market. Chart.
Sunday, January 30, 2011
The Fed Is Falling Behind On QE 2
The Fed started off a bit slowly in providing its promised $600 bil. of additional funds to the
financial system. It added only $11 bil. in the month of Jan. and is now well behind a sensible
straight line funding approach to meeting the $600 bil. target by 6/30/11. The Fed may simply
have followed a traditional pattern of either freezing or draining liquidity after the holiday
season, but if they are not planning to welch on the deal, I doubt there is a good reason for
holding off on stepping up the funding process straightaway. Otherwise, further delay could
add unnecessary volatility to the commodities, forex and capital markets. For example, further
delay in program execution could invite the major dealers to buy bonds and short stocks etc.,
only to reverse these trades when the Fed steps up to the plate again. With the global markets
now nervous about Egypt and oil transport security, it would be wise for the Fed to step in
this week with a significant round of Treasuries purchases.
financial system. It added only $11 bil. in the month of Jan. and is now well behind a sensible
straight line funding approach to meeting the $600 bil. target by 6/30/11. The Fed may simply
have followed a traditional pattern of either freezing or draining liquidity after the holiday
season, but if they are not planning to welch on the deal, I doubt there is a good reason for
holding off on stepping up the funding process straightaway. Otherwise, further delay could
add unnecessary volatility to the commodities, forex and capital markets. For example, further
delay in program execution could invite the major dealers to buy bonds and short stocks etc.,
only to reverse these trades when the Fed steps up to the plate again. With the global markets
now nervous about Egypt and oil transport security, it would be wise for the Fed to step in
this week with a significant round of Treasuries purchases.
Friday, January 28, 2011
Stock Market, Oil Price, Arab Unrest
Stock Market
I have argued unsuccessfully for several weeks that the market was due for a sharp, short
term pullback. It took the hit today as traders used weaker than expected economic news and
a spike in the oil price to take some profits. The SP 500 has broken below its 10 and 25 day
m/a's, thus signaling a possible and negative change of direction. At this point, it is wise
to pay attention to see how much, if any negative follow through takes place. SP 500 chart.
Oil Price
The oil price started the week with a contra-seasonal price decline, but the shorts moved
quickly today to cover and sent the price up around $4.00 bl. The Arab region is seeing
increasing turmoil and with a weekend ahead, the boyz, fearful of a contagion of turbulence,
decided to even up and await developments. Oil price.
Arab Unrest
It is a region of bad governments and has been for years. Global recession shook sizable
parts of the area, and now rising food prices are straining household budgets. A number
of Arab countries have watched former struggling LDCs like China, India and Brazil
arise and flourish economically, while they have chafed under corrupt regimes which have
shown little interest in providing programs to develop their own economies. Arabs in
countries like Egypt, Tunisia, Algeria and Yemen to name several have realized ever more
clearly that being backwater states need not be their lot in life. So, with Ben Ali having
been chased and people out on the streets to challenge in Egypt and Yemen as well, there
could be revolution in the making, and the capital markets are taking note. As of today, there
are far more questions than answers, and investors and traders need to be careful not to
leap too far forward of the emerging narrative.
I have argued unsuccessfully for several weeks that the market was due for a sharp, short
term pullback. It took the hit today as traders used weaker than expected economic news and
a spike in the oil price to take some profits. The SP 500 has broken below its 10 and 25 day
m/a's, thus signaling a possible and negative change of direction. At this point, it is wise
to pay attention to see how much, if any negative follow through takes place. SP 500 chart.
Oil Price
The oil price started the week with a contra-seasonal price decline, but the shorts moved
quickly today to cover and sent the price up around $4.00 bl. The Arab region is seeing
increasing turmoil and with a weekend ahead, the boyz, fearful of a contagion of turbulence,
decided to even up and await developments. Oil price.
Arab Unrest
It is a region of bad governments and has been for years. Global recession shook sizable
parts of the area, and now rising food prices are straining household budgets. A number
of Arab countries have watched former struggling LDCs like China, India and Brazil
arise and flourish economically, while they have chafed under corrupt regimes which have
shown little interest in providing programs to develop their own economies. Arabs in
countries like Egypt, Tunisia, Algeria and Yemen to name several have realized ever more
clearly that being backwater states need not be their lot in life. So, with Ben Ali having
been chased and people out on the streets to challenge in Egypt and Yemen as well, there
could be revolution in the making, and the capital markets are taking note. As of today, there
are far more questions than answers, and investors and traders need to be careful not to
leap too far forward of the emerging narrative.
Wednesday, January 26, 2011
Monetary Policy
My policy indicators may have all turned the corner in favor of having the Federal Reserve
raise interest rates, but the upward direction of several of them may have to continue on
for months before the evidence becomes more nearly conclusive. Specifically, producer
operating rates have recovered sharply, but are still on the low side, while short term
business credit demand, although perhaps coming off a cyclical low, is still very depressed.
If the economic recovery proceeds a little faster this year and more steadily, the traditional
case for raising short rates would be in place by very late this year.
My shorter term business credit supply / demand pressure gauge is very weak when it falls
below a reading of -7.0. In the wake of the 2000 - 2001 economic downturn, the gauge dropped
to a -9.5 in 2003 as the credit excesses of the telecom / tech / dot.com bubble were washed
out. The gauge fell to a staggering -18.5 in early 2010 following the near economic depression.
The gauge has recovered to a still very weak -8.9 and could rise to equilibrium at 0.0 by
the middle of this year. It is not for nothing that the Fed cut the FF target rate to between 0.0 -
0.25%.
One factor you can monitor here is the relationship between banking system holdings
of Treasuries and Agencies and the level of commercial and industrial loans. When recession
strikes, banks build liquidity by buying short Treasuries and letting C&I loans run off. On the
eve of the onset of economic free fall in mid 2008, the banks held $1.2 tril. in Treasuries
against $1.6 tril. in C&I loans. Now, they hold over $1.6 tril. in Treasuries and a little over
$1.2 tril in C&I. The Fed watches this balance carefully, and when the economy is
recovering and the banks are taking on new C&I and letting Treasuries run off, They will take
careful note of that (banking system data).
You should also keep an eye on certain market shorter term interest rates as the year progresses
to see if market players are anticipating the Fed will be raising rates. You can watch 270 day
commercial paper, 1 and 2 year Treasury yields and 12 month Libor. These indicators are
far from infallible as guides to policy, but are well worth watching.
raise interest rates, but the upward direction of several of them may have to continue on
for months before the evidence becomes more nearly conclusive. Specifically, producer
operating rates have recovered sharply, but are still on the low side, while short term
business credit demand, although perhaps coming off a cyclical low, is still very depressed.
If the economic recovery proceeds a little faster this year and more steadily, the traditional
case for raising short rates would be in place by very late this year.
My shorter term business credit supply / demand pressure gauge is very weak when it falls
below a reading of -7.0. In the wake of the 2000 - 2001 economic downturn, the gauge dropped
to a -9.5 in 2003 as the credit excesses of the telecom / tech / dot.com bubble were washed
out. The gauge fell to a staggering -18.5 in early 2010 following the near economic depression.
The gauge has recovered to a still very weak -8.9 and could rise to equilibrium at 0.0 by
the middle of this year. It is not for nothing that the Fed cut the FF target rate to between 0.0 -
0.25%.
One factor you can monitor here is the relationship between banking system holdings
of Treasuries and Agencies and the level of commercial and industrial loans. When recession
strikes, banks build liquidity by buying short Treasuries and letting C&I loans run off. On the
eve of the onset of economic free fall in mid 2008, the banks held $1.2 tril. in Treasuries
against $1.6 tril. in C&I loans. Now, they hold over $1.6 tril. in Treasuries and a little over
$1.2 tril in C&I. The Fed watches this balance carefully, and when the economy is
recovering and the banks are taking on new C&I and letting Treasuries run off, They will take
careful note of that (banking system data).
You should also keep an eye on certain market shorter term interest rates as the year progresses
to see if market players are anticipating the Fed will be raising rates. You can watch 270 day
commercial paper, 1 and 2 year Treasury yields and 12 month Libor. These indicators are
far from infallible as guides to policy, but are well worth watching.
Monday, January 24, 2011
Stock Market Valuation
My SP 500 Market Tracker is an entirely empirically based way to value the market. The
"500" kept up nicely with the Tracker in the current cyclical bull until May, 2010. The
Tracker kept on rising, but the market corrected sharply on concerns about the sustainability
of the economic recovery. The Tracker now stands with fair value at 1400. So, even with the
strong market recovery of the past five months, the SP 500 stands at an 8% discount to Tracker
value. Investors have recovered some of the confidence lost over the spring / early summer,
but remain wary.
From a fundamental point of view, the market is now trading at a reasonable 13.6x consensus
earnings for 2011, and a still reasonable 14.5x my more conservative estimate. Whether
investor confidence recovers enough to catch up with the Tracker over the rest of this year
remains to be seen.
Investors are now not worried about accelerating inflation or rising short term interest rates.
Instead the focus is on whether the economy can develop enough internal balance to sustain
positive direction so that stimulus programs are not integral to growth. Regaining that balance
is still a matter that is "on the come". The more proximate focus of investor attention is on
the continuing positive trend of earnings.
If I was a long term investor with a minimum five year time horizon, I would be cautious
about adding to long term holdings at this level as I believe true long distance positions
should be purchased cheaply. There were nice windows of opportunity through 2009 and
during the sharp correction of May - Aug. 2010, but I would not be interested in taking
on more true long unless and until the SP 500 drops to 1240 or lower. Cyclical players who
are looking out 1-3 years should find their own comfort levels by applying their own
disciplines.
I continue to be unhappy with the corporate world. The dividend yield on the SP 500 is
a paltry 1.8%. This means that if you are long the market you need to count on earnings
growth of 8.2% and /or an upward revaluation of the p/e ratio to earn a 10% annual return
which is reasonable for capital at risk. High earnings plowback by the SP 500 companies
over the past 10-15 years has not resulted in earnings growth faster than the long term
average. In my view, investors should demand much higher dividends.
"500" kept up nicely with the Tracker in the current cyclical bull until May, 2010. The
Tracker kept on rising, but the market corrected sharply on concerns about the sustainability
of the economic recovery. The Tracker now stands with fair value at 1400. So, even with the
strong market recovery of the past five months, the SP 500 stands at an 8% discount to Tracker
value. Investors have recovered some of the confidence lost over the spring / early summer,
but remain wary.
From a fundamental point of view, the market is now trading at a reasonable 13.6x consensus
earnings for 2011, and a still reasonable 14.5x my more conservative estimate. Whether
investor confidence recovers enough to catch up with the Tracker over the rest of this year
remains to be seen.
Investors are now not worried about accelerating inflation or rising short term interest rates.
Instead the focus is on whether the economy can develop enough internal balance to sustain
positive direction so that stimulus programs are not integral to growth. Regaining that balance
is still a matter that is "on the come". The more proximate focus of investor attention is on
the continuing positive trend of earnings.
If I was a long term investor with a minimum five year time horizon, I would be cautious
about adding to long term holdings at this level as I believe true long distance positions
should be purchased cheaply. There were nice windows of opportunity through 2009 and
during the sharp correction of May - Aug. 2010, but I would not be interested in taking
on more true long unless and until the SP 500 drops to 1240 or lower. Cyclical players who
are looking out 1-3 years should find their own comfort levels by applying their own
disciplines.
I continue to be unhappy with the corporate world. The dividend yield on the SP 500 is
a paltry 1.8%. This means that if you are long the market you need to count on earnings
growth of 8.2% and /or an upward revaluation of the p/e ratio to earn a 10% annual return
which is reasonable for capital at risk. High earnings plowback by the SP 500 companies
over the past 10-15 years has not resulted in earnings growth faster than the long term
average. In my view, investors should demand much higher dividends.
Saturday, January 22, 2011
Stock Mkt. Fundamentals -- Directional
My primary indicators have returned to 100% positive. The basic money supply indicators
have experienced a re-acceleration of growth since autumn, 2010 on the heels of Fed
implementation of its $600 bil. quantitative easing program and intermediate grade bond prices
have ralled in Jan. For now, the Fed seems reasonably determined to complete its easing program,
with 6/30/11 set as the wind-up date. It is very likely that by Apr. /May, market players and
economists will be speculating freely about Fed. intent beyond 6/30. In the present though,
we have a classic "easy money" environment where the longs are betting with the Fed.
The economy has been growing more rapidly than has my broad credit driven measure of system
liquidity, which normally creates at least a headwind for the market. However, I would note that
retail money funds were drawn down heavily over Half '2 2010. Much of this money may have
gone into retail sales, but some of it may well have found itself into the market. I also note
that institutional money market funds, which rose over the 3rd quarter of 2010 when the market
struggled, were drawn down sharply in Q4. This development helped the market rally
as did a rotation from Treasuries into lesser quality corporates and stocks. So, there were some
broader liquidity and rotational factors which helped the market rally strongly over the latter
part of the year, but continuation of these trends cannot simply be counted on going forward.
I do expect earnings growth momentum to slow markedly relative to the longer term trend
line by late 2011, but not by enough to significantly bother market players who are usually
willing to stay positive on the market so long as earnings do not look likely to trend negative (I
often do not share investor generosity on this score).
My weekly fundamentals coincident market indicator has been rising strongly since late Aug. '10,
right along with the market. This indicator jumped very strongly in Dec. and has lost positive
momentum so far in Jan., but the main trend continues up. (Note: this indicator is not so useful
for shorter term timing as data availability only becomes available toward the end of each
trading week. But it has its uses in the shorter run. For example, the indicator was unusually
strong in Dec. '10. Loss of positive thrust so far in Jan. could make some players more wary in
the near term.)
have experienced a re-acceleration of growth since autumn, 2010 on the heels of Fed
implementation of its $600 bil. quantitative easing program and intermediate grade bond prices
have ralled in Jan. For now, the Fed seems reasonably determined to complete its easing program,
with 6/30/11 set as the wind-up date. It is very likely that by Apr. /May, market players and
economists will be speculating freely about Fed. intent beyond 6/30. In the present though,
we have a classic "easy money" environment where the longs are betting with the Fed.
The economy has been growing more rapidly than has my broad credit driven measure of system
liquidity, which normally creates at least a headwind for the market. However, I would note that
retail money funds were drawn down heavily over Half '2 2010. Much of this money may have
gone into retail sales, but some of it may well have found itself into the market. I also note
that institutional money market funds, which rose over the 3rd quarter of 2010 when the market
struggled, were drawn down sharply in Q4. This development helped the market rally
as did a rotation from Treasuries into lesser quality corporates and stocks. So, there were some
broader liquidity and rotational factors which helped the market rally strongly over the latter
part of the year, but continuation of these trends cannot simply be counted on going forward.
I do expect earnings growth momentum to slow markedly relative to the longer term trend
line by late 2011, but not by enough to significantly bother market players who are usually
willing to stay positive on the market so long as earnings do not look likely to trend negative (I
often do not share investor generosity on this score).
My weekly fundamentals coincident market indicator has been rising strongly since late Aug. '10,
right along with the market. This indicator jumped very strongly in Dec. and has lost positive
momentum so far in Jan., but the main trend continues up. (Note: this indicator is not so useful
for shorter term timing as data availability only becomes available toward the end of each
trading week. But it has its uses in the shorter run. For example, the indicator was unusually
strong in Dec. '10. Loss of positive thrust so far in Jan. could make some players more wary in
the near term.)
Wednesday, January 19, 2011
The US & China....
Today's State visit by Pres. Hu of China to the White House played to a light and fidgety crowd.
Top GOP members of Congress are passing on attending this evening's State dinner. China has
lost in the court of American public opinion, and this will make dealings between the two countries
far more difficult going forward. Now that most Americans are leery and distrustful of China, the
way will be open here for politicians to scapegoat and demagogue on China. China public
opinion has been adverserial to the US for years, and now that sense of a formidable adversary
will be reciprocated. Focus is strengthening in the US on the issues of jobs seen lost to China,
an ever rising level of subpar quality goods from China (toys, pharma, construction materials)
and questions over just how tightly the civilian side of China's gov. controls its military.
Although it is doubtful that a broader deterioration in the foundation of the US - China relation-
ship will have consequences for the capital markets in the year ahead, we are starting a new
and more tense chapter.
Top GOP members of Congress are passing on attending this evening's State dinner. China has
lost in the court of American public opinion, and this will make dealings between the two countries
far more difficult going forward. Now that most Americans are leery and distrustful of China, the
way will be open here for politicians to scapegoat and demagogue on China. China public
opinion has been adverserial to the US for years, and now that sense of a formidable adversary
will be reciprocated. Focus is strengthening in the US on the issues of jobs seen lost to China,
an ever rising level of subpar quality goods from China (toys, pharma, construction materials)
and questions over just how tightly the civilian side of China's gov. controls its military.
Although it is doubtful that a broader deterioration in the foundation of the US - China relation-
ship will have consequences for the capital markets in the year ahead, we are starting a new
and more tense chapter.
Tuesday, January 18, 2011
Small Vs. Big Cap Stocks
Small and mid-cap stocks have left the big caps in the dust over the past 15 years here in the
US. On a risk / reward basis, smaller caps are supposed to outperform the large, established
companies over the longer term, because the small fry aggregates contain those companies
destined to grow into much bigger companies. The preference of investors for small and mid-cap
US companies coupled with increasing diversification into foreign stock markets have played
an important role in turning big cap measures such as the Dow 30 and SP 500 into sources
of funds over the past decade.
This year, as in the past five or so, many strategists are proclaiming that now is the time to move
out of the little guys into the bigs. Now there are some structural reasons for this optimism
centered around the poor performance over the years of many of the big cap techs like Intel and
Microsoft along with the more recent collapse of a number big cap financials such as Citi et al.
This is a good point, because there have been an unusually high number of big cap tank jobs over
the past decade.
Strategists also point to a good sized p/e ratio discount of the bigs when compared to the smalls.
This is a more challenging issue. Looking out through 2011, the SP 500 is trading at near 14x
earnings compared to near 17x earnings for the Russell 2000 ($RUT). But you have to be very
careful here. Realistically, you could project longer run earnings growth of 6.6% for the "500".
However, analysts have the Russell 2000 clocking out at 12.7% aggregate eps growth longer
term. It is proper to question whether the small / mid-caps can grow so much faster than the
major caps for years to come, and the issue would be critical if the p/e premium for the smaller
caps was much larger.
The best time to own the larger caps is when the p/e against the smalls is comparable to
that of the smaller guys, while the growth potential for the major companies is equal to
or greater than the smaller cap stocks. This does happen from time to time, and it occurs
most notably when there are big cap sectors with strong new product / services growth
such as occured with big techs and pharma some years back.
Now I also believe that the current US recovery could take a number of years to run, so
I am less skeptical of the projected earnings growth for the smaller caps than I normally
would be.
If I was running large pools of equity capital now as in the old days, I probably would be
reluctant to screen candidates on the basis of capitalization size at this juncture. I would be
inclined to let the economy run for a good couple of years before putting up cap size screens.
I plan to return to this interesting but difficult issue in a few months.
View chart for a look at the relative strength of the Russell 2000 small cap vs the SP 500.
Note that there is currently rotation in favor of the big caps following strong end of year
2010 by the "2000."
US. On a risk / reward basis, smaller caps are supposed to outperform the large, established
companies over the longer term, because the small fry aggregates contain those companies
destined to grow into much bigger companies. The preference of investors for small and mid-cap
US companies coupled with increasing diversification into foreign stock markets have played
an important role in turning big cap measures such as the Dow 30 and SP 500 into sources
of funds over the past decade.
This year, as in the past five or so, many strategists are proclaiming that now is the time to move
out of the little guys into the bigs. Now there are some structural reasons for this optimism
centered around the poor performance over the years of many of the big cap techs like Intel and
Microsoft along with the more recent collapse of a number big cap financials such as Citi et al.
This is a good point, because there have been an unusually high number of big cap tank jobs over
the past decade.
Strategists also point to a good sized p/e ratio discount of the bigs when compared to the smalls.
This is a more challenging issue. Looking out through 2011, the SP 500 is trading at near 14x
earnings compared to near 17x earnings for the Russell 2000 ($RUT). But you have to be very
careful here. Realistically, you could project longer run earnings growth of 6.6% for the "500".
However, analysts have the Russell 2000 clocking out at 12.7% aggregate eps growth longer
term. It is proper to question whether the small / mid-caps can grow so much faster than the
major caps for years to come, and the issue would be critical if the p/e premium for the smaller
caps was much larger.
The best time to own the larger caps is when the p/e against the smalls is comparable to
that of the smaller guys, while the growth potential for the major companies is equal to
or greater than the smaller cap stocks. This does happen from time to time, and it occurs
most notably when there are big cap sectors with strong new product / services growth
such as occured with big techs and pharma some years back.
Now I also believe that the current US recovery could take a number of years to run, so
I am less skeptical of the projected earnings growth for the smaller caps than I normally
would be.
If I was running large pools of equity capital now as in the old days, I probably would be
reluctant to screen candidates on the basis of capitalization size at this juncture. I would be
inclined to let the economy run for a good couple of years before putting up cap size screens.
I plan to return to this interesting but difficult issue in a few months.
View chart for a look at the relative strength of the Russell 2000 small cap vs the SP 500.
Note that there is currently rotation in favor of the big caps following strong end of year
2010 by the "2000."
Saturday, January 15, 2011
Earnings Indicators & Comment
Profits indicators were positive through the year and ended 2010 on a strong note as business
sales recovery accelerated in Q' 4. SP 500 profits are expected to come in at around $84, up
about 48% from a depressed 2009. S&P sales rose around 6% and margins expanded on a
reduced cost structure, with a nice portion of incremental sales falling to the bottom line.
Net revenue from the large financial services sector contracted by 11%, so non-financial
business sales were materially stronger than total sales. In addition, financials' earnings
benefited over Half '2 on a sizable decline in loan loss reserves.
The S&P estimate for "500" profits in 2011 is nearly $95 -- which would be a new record.
Many analysts, myself included, are more comfortable with a range of $90 - 93 for next year
based on reservations about continued profit margin improvement. As of now, two keys in
the outlook concern how fast oil revenues may grow and how rapidly the banks may allow
the loan loss reserve to contract as the economy improves.
The analysts have earnings progress through 2011 "back loaded", meaning the stronger gains
are seen coming over the second half of the year. Now, since the economy is entering 2011
with faster momentum, there could be upward revisions in the near term outlook for SP 500
net per share.
Looking at the longer term trend, quarterly earnings is seen as rising up to the mid-point of
the trend range. This is dramatic progress considering that the final quarter of 2008 saw
an operating loss -- the first since S&P started keeping data in the 1930's. Earnings in 2011
will come in well below trend peak levels, which would tend to reaffirm that the economy
will still be operating with considerable slack and that the potential should be there for
further significant progress provided the economy develops better internal balance as it
progresses further out of deep recession.
The dividend is projected to rise by another 8% in 2011 to over $25.50. I am not impressed.
The major corporations have a large and growing cash hoard which is earning them little.
The policy of a super high earnings plowback ratio has not boosted sustainable growth for
the SP 500. This and other aggressive balance sheet practices have only served to make
earnings more volatile on a cyclical basis. Jot me down for saying that "500" earning
power of $90+ calls for a $32 -35 dividend.
sales recovery accelerated in Q' 4. SP 500 profits are expected to come in at around $84, up
about 48% from a depressed 2009. S&P sales rose around 6% and margins expanded on a
reduced cost structure, with a nice portion of incremental sales falling to the bottom line.
Net revenue from the large financial services sector contracted by 11%, so non-financial
business sales were materially stronger than total sales. In addition, financials' earnings
benefited over Half '2 on a sizable decline in loan loss reserves.
The S&P estimate for "500" profits in 2011 is nearly $95 -- which would be a new record.
Many analysts, myself included, are more comfortable with a range of $90 - 93 for next year
based on reservations about continued profit margin improvement. As of now, two keys in
the outlook concern how fast oil revenues may grow and how rapidly the banks may allow
the loan loss reserve to contract as the economy improves.
The analysts have earnings progress through 2011 "back loaded", meaning the stronger gains
are seen coming over the second half of the year. Now, since the economy is entering 2011
with faster momentum, there could be upward revisions in the near term outlook for SP 500
net per share.
Looking at the longer term trend, quarterly earnings is seen as rising up to the mid-point of
the trend range. This is dramatic progress considering that the final quarter of 2008 saw
an operating loss -- the first since S&P started keeping data in the 1930's. Earnings in 2011
will come in well below trend peak levels, which would tend to reaffirm that the economy
will still be operating with considerable slack and that the potential should be there for
further significant progress provided the economy develops better internal balance as it
progresses further out of deep recession.
The dividend is projected to rise by another 8% in 2011 to over $25.50. I am not impressed.
The major corporations have a large and growing cash hoard which is earning them little.
The policy of a super high earnings plowback ratio has not boosted sustainable growth for
the SP 500. This and other aggressive balance sheet practices have only served to make
earnings more volatile on a cyclical basis. Jot me down for saying that "500" earning
power of $90+ calls for a $32 -35 dividend.
Friday, January 14, 2011
Coincident Economic Indicators
Paced by gains in retail sales, production and export sales, the US economy finished up 2010
on a stronger note than seemed likely at mid year in the midst of a brief but sudden, sharp
slowdown.
Measured yr/yr, output only indicators were up by around 4%. Gains in business sales and
production were strong at about 7% in real terms. The big offset continued to be the construction
markets, with new building activity down 20% from a depressed 2009 level despite some
improvement as 2010 progressed.
When the indicators are broadened out to include income and employment measures, then the
various coincidental activity composites drop to a +3% for the year on slow wage and real
earnings growth.
Monthly and weekly economic data do highlight an imbalance between the output and income
sides of the economy. The cut in the payroll tax and more stimulus goodies for businesses are
designed to boost the income side of the economy in 2011 with the expectation by policymakers
that stronger income growth will sustain moderate output growth.
_________________________________________________________________________________
Political Note: 'Tis true voters harbor deep anger and distrust of government after the economic /
financial disasters of 2008 - early 2009. But even more, there is anxiety about the future, and
most specifically about whether the jobs market will improve enough to support continued
economic recovery and further increments in home values. Since the campaigns for the Presidency
and the Congress in 2012 are already underway, politics in Washington will be judged strongly
by whether actions taken add to or diminish jobs growth prospects. The smarter course for the
Dems and the GOP would be to take bi-partisan steps as needed to better the employment
situation and let the battles for office be fought over other issues. I would not be surprised to
see grudging cooperation about growing employment and addressing the risks to the economy
from a still rising home forclosure rate. After all, the elections of 2006, 08 and 10 show that
loyalty is zilch for many voters. Since the states and municipalities are boxed in to greater
austerity by statute, it is the feds who will have to carry the ball.
on a stronger note than seemed likely at mid year in the midst of a brief but sudden, sharp
slowdown.
Measured yr/yr, output only indicators were up by around 4%. Gains in business sales and
production were strong at about 7% in real terms. The big offset continued to be the construction
markets, with new building activity down 20% from a depressed 2009 level despite some
improvement as 2010 progressed.
When the indicators are broadened out to include income and employment measures, then the
various coincidental activity composites drop to a +3% for the year on slow wage and real
earnings growth.
Monthly and weekly economic data do highlight an imbalance between the output and income
sides of the economy. The cut in the payroll tax and more stimulus goodies for businesses are
designed to boost the income side of the economy in 2011 with the expectation by policymakers
that stronger income growth will sustain moderate output growth.
_________________________________________________________________________________
Political Note: 'Tis true voters harbor deep anger and distrust of government after the economic /
financial disasters of 2008 - early 2009. But even more, there is anxiety about the future, and
most specifically about whether the jobs market will improve enough to support continued
economic recovery and further increments in home values. Since the campaigns for the Presidency
and the Congress in 2012 are already underway, politics in Washington will be judged strongly
by whether actions taken add to or diminish jobs growth prospects. The smarter course for the
Dems and the GOP would be to take bi-partisan steps as needed to better the employment
situation and let the battles for office be fought over other issues. I would not be surprised to
see grudging cooperation about growing employment and addressing the risks to the economy
from a still rising home forclosure rate. After all, the elections of 2006, 08 and 10 show that
loyalty is zilch for many voters. Since the states and municipalities are boxed in to greater
austerity by statute, it is the feds who will have to carry the ball.
Thursday, January 13, 2011
Gold Price
My view on gold remains unchanged since the early Oct. '10 post. I see the metal in a bubble
with an empirically warranted top of $1,500 oz. based on studies of a wide range of capital
markets bubbles over the years. This view is clearly well in the minority.
The gold price has lost its positive momentum in recent weeks after rallying strongly over the
autumn to overbought levels. It has recently fallen back through the top of its primary trend
band as it did in both early 2009 and 2010. Right now this looks like a normal pullback from
a shorter term extended position. Based on my weekly chart, I would have to say that gold, which
closed today at $1,373, could fall to $1,300 in the weeks ahead and still not violate the uptrend in
price in place since late 2008. A sharp break below $1,300, should it occur, could well be a
more serious matter.
I link to the weekly gold chart below, and I would note that the 12 wk. RSI is in a downtrend
which has rarely fallen much below 50% in recent years before the bulls have moved in to
support and rally the price (gold chart). So, sometime in the next few weeks we can look to
see if the bulls do jump in again to reverse the deterioration.
I have been using the leveraged short ETN, symbol DZZ, to trade against the gold price. I
am using a small portion of trading capital to do this and have made two round trips with
a total gain of 13%. As they say, do not try this at home.
with an empirically warranted top of $1,500 oz. based on studies of a wide range of capital
markets bubbles over the years. This view is clearly well in the minority.
The gold price has lost its positive momentum in recent weeks after rallying strongly over the
autumn to overbought levels. It has recently fallen back through the top of its primary trend
band as it did in both early 2009 and 2010. Right now this looks like a normal pullback from
a shorter term extended position. Based on my weekly chart, I would have to say that gold, which
closed today at $1,373, could fall to $1,300 in the weeks ahead and still not violate the uptrend in
price in place since late 2008. A sharp break below $1,300, should it occur, could well be a
more serious matter.
I link to the weekly gold chart below, and I would note that the 12 wk. RSI is in a downtrend
which has rarely fallen much below 50% in recent years before the bulls have moved in to
support and rally the price (gold chart). So, sometime in the next few weeks we can look to
see if the bulls do jump in again to reverse the deterioration.
I have been using the leveraged short ETN, symbol DZZ, to trade against the gold price. I
am using a small portion of trading capital to do this and have made two round trips with
a total gain of 13%. As they say, do not try this at home.
Wednesday, January 12, 2011
US Stock Market
Technical
I had been expecting the market to have a short but sharp sell off over the past ten odd trading
days because key indicators pointed to intense and seldom rewarded speculative short term
activity. There has been some easing in these measures, but not in others such as RSI and
the CBOE weekly equities only put / call ratio.
The market remains in a firm uptrend. It has been continuously but modestly overbought on my
short term price oscillator and ditto my short run market breadth measures. The SP 500 is now
running 11.7% over its 200 day m/a. That represents a moderate overbought viewed a bit longer
term. The extended view 40 day RSI is now overbought at 60+%.
Obviously, there is a correction due before long, but it is hard to be more than wary with
trending factors so solidly positive for now. SP 500 chart.
Fundamentals
I will be brief here as a longer post on the fundamentals is coming soon. Core measures
remain positive, but there is still a headwind coming from inadequate growth of broader,
credit driven measures of liquidity. The market probably got a little extra lift in recent
months from rotation out of Treasuries into stocks, a move that does not require sharp
incremental liquidity (See chart below). My weekly coincident fundamental indicator
continues to rise, powered by a fast rise in sensitive materials prices and a hefty recent
decline of unemployment insurance claims. The coincident indicator turned up sharply
with stocks in early Sept., 2010.
Here is a chart which compares the SP 500 Spyder with the long Treasury price. Chart.
I had been expecting the market to have a short but sharp sell off over the past ten odd trading
days because key indicators pointed to intense and seldom rewarded speculative short term
activity. There has been some easing in these measures, but not in others such as RSI and
the CBOE weekly equities only put / call ratio.
The market remains in a firm uptrend. It has been continuously but modestly overbought on my
short term price oscillator and ditto my short run market breadth measures. The SP 500 is now
running 11.7% over its 200 day m/a. That represents a moderate overbought viewed a bit longer
term. The extended view 40 day RSI is now overbought at 60+%.
Obviously, there is a correction due before long, but it is hard to be more than wary with
trending factors so solidly positive for now. SP 500 chart.
Fundamentals
I will be brief here as a longer post on the fundamentals is coming soon. Core measures
remain positive, but there is still a headwind coming from inadequate growth of broader,
credit driven measures of liquidity. The market probably got a little extra lift in recent
months from rotation out of Treasuries into stocks, a move that does not require sharp
incremental liquidity (See chart below). My weekly coincident fundamental indicator
continues to rise, powered by a fast rise in sensitive materials prices and a hefty recent
decline of unemployment insurance claims. The coincident indicator turned up sharply
with stocks in early Sept., 2010.
Here is a chart which compares the SP 500 Spyder with the long Treasury price. Chart.
Friday, January 07, 2011
Economic Indicators / Analysis
Economic Power Index
The EPI -- yr/yr % change in real wage + yr/yr % change in civilian employment -- jumped to a
strong 4.5 in Dec., its highest reading in several years. The basic EPI was only a paltry 1.3.
Extra hours worked and overtime added 1.2, and the temporary cut in the FICA payroll tax
added about 2.0%. With further employment gains indicated in the months ahead, the EPI is
sufficient to underwrite a significantly stronger economy in 2011. However, the current EPI is
hardly as healthy as it looks viewed longer term. The payroll tax cut is only a 12 month deal, and
one cannot count on strong extra time hours each month along the way. What is still needed, is a
much stronger basic EPI, with healthier real wage growth and an acceleration in jobs growth.
Civilian employment rose modestly in Dec., but was only slightly higher than at the 2010 mid
point and is down from the Apr. '10 level. The leading economic indicators suggest the higher
payroll numbers are in the cards, but for the last 8 months, businesses have talked the talk about
hiring, but have not followed through. with the labor market weak, companies have also slashed
wage growth to buttress profits. If this does not change for the better, do not blame consumers if
they tighten budgets some. And, if you were wondering, well you can bet your ass that senior
managers did not walk away with 1.9% compensation gains on the year. Paid like rock stars.
Capital Slack Measure
High unemployment, low capacity utilization % and near zero short term interest rates all attest
to large idle resources in the US., and underscore the Fed's concern about slipping into a
deflationary period if the economy fails to respond more vigorously. The high amount of slack
also suggests the economy can expand for a good 4-5 years easily if there is further improvement
in the balance of supply and demand for goods and services including especially credit and
employment.
*************************************************************************************
Investors face challenging strategy issues in 2011. The Fed's QE 2 program expires at mid year.
The payroll tax benefit expires at the end of this year. Businesses need to step up hiring, and
the banks have to re-enter the credit market with sensible, expansive loan programs. Last year
was a poor recovery period, and the stock market p/e multiple was suppressed despite strong
profits on cost cutting. Bondholders saw handsome gains dissipate over Half 2 '10, and savers
were screwed yet again. Looking forward, my advice would be that you minimize the assumptions
you make (especially the grand ones) and srutinize your basic premises about the economic /
financial environment frequently. I am not calling for a turbulent, volatile year, but you will
need to get the basics right to do well. No coasting I think.
The EPI -- yr/yr % change in real wage + yr/yr % change in civilian employment -- jumped to a
strong 4.5 in Dec., its highest reading in several years. The basic EPI was only a paltry 1.3.
Extra hours worked and overtime added 1.2, and the temporary cut in the FICA payroll tax
added about 2.0%. With further employment gains indicated in the months ahead, the EPI is
sufficient to underwrite a significantly stronger economy in 2011. However, the current EPI is
hardly as healthy as it looks viewed longer term. The payroll tax cut is only a 12 month deal, and
one cannot count on strong extra time hours each month along the way. What is still needed, is a
much stronger basic EPI, with healthier real wage growth and an acceleration in jobs growth.
Civilian employment rose modestly in Dec., but was only slightly higher than at the 2010 mid
point and is down from the Apr. '10 level. The leading economic indicators suggest the higher
payroll numbers are in the cards, but for the last 8 months, businesses have talked the talk about
hiring, but have not followed through. with the labor market weak, companies have also slashed
wage growth to buttress profits. If this does not change for the better, do not blame consumers if
they tighten budgets some. And, if you were wondering, well you can bet your ass that senior
managers did not walk away with 1.9% compensation gains on the year. Paid like rock stars.
Capital Slack Measure
High unemployment, low capacity utilization % and near zero short term interest rates all attest
to large idle resources in the US., and underscore the Fed's concern about slipping into a
deflationary period if the economy fails to respond more vigorously. The high amount of slack
also suggests the economy can expand for a good 4-5 years easily if there is further improvement
in the balance of supply and demand for goods and services including especially credit and
employment.
*************************************************************************************
Investors face challenging strategy issues in 2011. The Fed's QE 2 program expires at mid year.
The payroll tax benefit expires at the end of this year. Businesses need to step up hiring, and
the banks have to re-enter the credit market with sensible, expansive loan programs. Last year
was a poor recovery period, and the stock market p/e multiple was suppressed despite strong
profits on cost cutting. Bondholders saw handsome gains dissipate over Half 2 '10, and savers
were screwed yet again. Looking forward, my advice would be that you minimize the assumptions
you make (especially the grand ones) and srutinize your basic premises about the economic /
financial environment frequently. I am not calling for a turbulent, volatile year, but you will
need to get the basics right to do well. No coasting I think.
Thursday, January 06, 2011
Global Economy Snapshot
Paced by the US, the growth of the global economy likely did pick up in Dec. '10.
So did the breadth of inflation pressures, with the number of companies reporting higher
input prices rising to a 27 month high. JP Morgan, Chase / Markit report.
So did the breadth of inflation pressures, with the number of companies reporting higher
input prices rising to a 27 month high. JP Morgan, Chase / Markit report.
Leading Economic Indicators
The weekly leading indicators re-entered a firm uptrend at the end of Aug. 2010. The positive trend remains intact. The indicators portend continuing economic recovery through Q1 '11. These
indicators were not entirely helpful over Half 2 '10, especially as retail sales -- a coincident
economic indicator -- turned up in Jul. and has been trending positive since. Moreover, the weekly
leading data badly overstated the pace of recovery from 2009 - early 2010, and then badly over-
stated the spring/summer slowdown of this year. The data has its uses, but one has to adjust for
the substantial lack of linearity between the indicators and implied economic performance.
the monthly US Conference Board leading data is trending positive and has painted a less misleading
picture of the path of economic of economic recovery in 2010 than did the weeklies. The monthly
new orders diffusion index turn positive again in Sep. after several months of decline. It has turned
sharply higher and the reading for Dec. matched the cyclical high points seen over Apr. / May.
This indicator has also indicated the prospect of continuous recovery since 03/09.
My longer term leading economic indicator has remained postive since late 2008. Readings
through most of 2010 have been more modest than at the end of 2008, when the indicator was
exceptionally strong. The partial loss of momentum in the trend of the indicator reflects a
rising real oil price, a moderation of the real wage and the error by the Fed of tightening
monetary liquidity earlier in 2010 even as the broader measure of credit driven liquidity
struggled to stay flat. The QE '2 easing program started this past autumn will rectify that mistake
of judgment by the Fed and strengthens the indicator.
My inflation pressure gauges turned up again around mid 2010, and are in firm uptrends.
Capacitiy utilization % is once more recovering, but the real action has been from sharply
rising commodities prices. Clearly, higher inflation readings are ahead as the upturn in the
commodities baskets passes through the system.
In sum, the indicators suggest an acceleration of both the pace of economic recovery and
that of inflation as we move into 2011. In turn, the longer term indicators point to another
year of economic recovery ahead.
------------------------------------------------------------------------------------------------------------
The long Treasury yield is an ok economic indicator on its own as it encapsulates the collective
view of investors and traders regarding the outlook for economic growth and for inflation.
$TYX chart.
indicators were not entirely helpful over Half 2 '10, especially as retail sales -- a coincident
economic indicator -- turned up in Jul. and has been trending positive since. Moreover, the weekly
leading data badly overstated the pace of recovery from 2009 - early 2010, and then badly over-
stated the spring/summer slowdown of this year. The data has its uses, but one has to adjust for
the substantial lack of linearity between the indicators and implied economic performance.
the monthly US Conference Board leading data is trending positive and has painted a less misleading
picture of the path of economic of economic recovery in 2010 than did the weeklies. The monthly
new orders diffusion index turn positive again in Sep. after several months of decline. It has turned
sharply higher and the reading for Dec. matched the cyclical high points seen over Apr. / May.
This indicator has also indicated the prospect of continuous recovery since 03/09.
My longer term leading economic indicator has remained postive since late 2008. Readings
through most of 2010 have been more modest than at the end of 2008, when the indicator was
exceptionally strong. The partial loss of momentum in the trend of the indicator reflects a
rising real oil price, a moderation of the real wage and the error by the Fed of tightening
monetary liquidity earlier in 2010 even as the broader measure of credit driven liquidity
struggled to stay flat. The QE '2 easing program started this past autumn will rectify that mistake
of judgment by the Fed and strengthens the indicator.
My inflation pressure gauges turned up again around mid 2010, and are in firm uptrends.
Capacitiy utilization % is once more recovering, but the real action has been from sharply
rising commodities prices. Clearly, higher inflation readings are ahead as the upturn in the
commodities baskets passes through the system.
In sum, the indicators suggest an acceleration of both the pace of economic recovery and
that of inflation as we move into 2011. In turn, the longer term indicators point to another
year of economic recovery ahead.
------------------------------------------------------------------------------------------------------------
The long Treasury yield is an ok economic indicator on its own as it encapsulates the collective
view of investors and traders regarding the outlook for economic growth and for inflation.
$TYX chart.
Monday, January 03, 2011
Stock Market -- Technical
The cyclical bull market remains intact. The current leg up off the early 07/10 low represents
the second major up leg, with the real action not getting started until the end of Aug.'10.
The current move up is very strong off the late Aug. low and has the potential to carry the
SP 500 up to longer term resistance at 1300 by the end of Jan. 2011.
The market is not strongly overbought on my shorter term price oscillator, but internal trend
measure (ADX), 13 week momentum and intense speculative interest via heavy call buying
all signal to me that a fast, sharp sell-off is close at hand. In addition, the TRIN measure
(relative strength of down volume vs up volume), which helped me identify the Jul. '10 low
as an exceptionally sold out period, is now flashing a very strong overbought. So, I am cautious
in the very short term.
Looking a little further out in time, I am conjecturing that we could see a more pronounced
correction in the market sometime over the mid Feb. / mid Mar. time frame. I am simply
guessing that such a correction would be about 7% off a cyclical high of 1350 on the SP500.
From a technical perspective, the first step for me in 2011 is to see if a quick sell down
may be at hand in the days just ahead.
SP500 chart with ADX in bottom panel.
the second major up leg, with the real action not getting started until the end of Aug.'10.
The current move up is very strong off the late Aug. low and has the potential to carry the
SP 500 up to longer term resistance at 1300 by the end of Jan. 2011.
The market is not strongly overbought on my shorter term price oscillator, but internal trend
measure (ADX), 13 week momentum and intense speculative interest via heavy call buying
all signal to me that a fast, sharp sell-off is close at hand. In addition, the TRIN measure
(relative strength of down volume vs up volume), which helped me identify the Jul. '10 low
as an exceptionally sold out period, is now flashing a very strong overbought. So, I am cautious
in the very short term.
Looking a little further out in time, I am conjecturing that we could see a more pronounced
correction in the market sometime over the mid Feb. / mid Mar. time frame. I am simply
guessing that such a correction would be about 7% off a cyclical high of 1350 on the SP500.
From a technical perspective, the first step for me in 2011 is to see if a quick sell down
may be at hand in the days just ahead.
SP500 chart with ADX in bottom panel.
Friday, December 31, 2010
Picking Up Russia Stock Market
A goodly number of readers of the blog are from Russia. Since the view on Russia of an old
US pro might be of interest over there, I am adding Russia to my list of foreign stock markets
of interest. Russia is a resource based economy. Their market tracks well with my global basic
industry indicator, the oil price and the US stock market. The Russian market trades at a huge
p/e discount to the global average, but features well above average volatility. So, despite all
the qualms one might have about Russia's financial, legal and political systems, there is value in
the market and the kind of "beta" or volatility that would warm the hearts of most traders.
The Russian market fell around 90% in the financial panic / global recession of Half 2 '08 -
early 2009. This compares to a 77% drop in the oil price and a 32% decline in my global
basic industry indicator over the same period. Since the bottom in early 2009, the Russian
market has recouped much of the loss, but still stands about 32% below the previous high.
The oil price has made a similar recovery, and the global basic industry index has rebounded
strongly on rising production and sharply higher industrial commodities prices.
The oil market is crucial to Russian fiscal policy and broader economic strategy, and with a
global economic recovery underway, elemental risk should be only moderate for the economy
over the next couple of years.
So, Russia looks to be interesting for traders and investors in 2011 and beyond. The market
is presently overbought in the short run, having rallied nicely along with the oil price and
the SP 500. Time for me to watch it carefully going forward as there could be some nice
tradeable opportunities next year.
See chart for comparison of Russian, US stock markets and the oil price.
US pro might be of interest over there, I am adding Russia to my list of foreign stock markets
of interest. Russia is a resource based economy. Their market tracks well with my global basic
industry indicator, the oil price and the US stock market. The Russian market trades at a huge
p/e discount to the global average, but features well above average volatility. So, despite all
the qualms one might have about Russia's financial, legal and political systems, there is value in
the market and the kind of "beta" or volatility that would warm the hearts of most traders.
The Russian market fell around 90% in the financial panic / global recession of Half 2 '08 -
early 2009. This compares to a 77% drop in the oil price and a 32% decline in my global
basic industry indicator over the same period. Since the bottom in early 2009, the Russian
market has recouped much of the loss, but still stands about 32% below the previous high.
The oil price has made a similar recovery, and the global basic industry index has rebounded
strongly on rising production and sharply higher industrial commodities prices.
The oil market is crucial to Russian fiscal policy and broader economic strategy, and with a
global economic recovery underway, elemental risk should be only moderate for the economy
over the next couple of years.
So, Russia looks to be interesting for traders and investors in 2011 and beyond. The market
is presently overbought in the short run, having rallied nicely along with the oil price and
the SP 500. Time for me to watch it carefully going forward as there could be some nice
tradeable opportunities next year.
See chart for comparison of Russian, US stock markets and the oil price.
Tuesday, December 28, 2010
S&P 500 Profits
With a recent strengthening of the economic indicators, profits estimates are again being
revised up, but in typical modest fashion. SP 500 profits are expected to rise 47% in 2010
to around the $83.70 level reflecting about 8% sales growth and higher profit margins from
dramatic cost cutting. The bulk of the sales increase reflects higher unit volume, with pricing
power remaining modest. Higher profit margin is somewhat overstated by a rising level of
share buy ins as cash flow rises and companies gently increase underlying leverage and ROE%.
Analysts in sum now look for 2011 profits to rise to a record $94.80 per share, for a gain of
13.3%. Confidence in this good an increase is on the rise, in line with the recent improvement
in the economic indicators and further liberalization of fiscal and monetary policy. To do this
well in a continuing environment of modest pricing power, companies will again need to show
good volume gains and further operating efficiencies.
I am using a number around $90 a share for SP 500 eps in 2011. That would represent a 7.5%
increase over the current estimate for 2010. I am using the more conservative figure because
I am not as yet willing to make more generous growth assumptions beyond mid 2011, when
the Fed must again make another decision regarding quantitative easing. Moreover, I want
time to assess to what extent companies are willing to increase hiring and whether the
markets for private sector shorter term credit will begin to loosen up.
I continue to think there is ample slack in the US economy and that recovery / expansion
can easily proceed for another 4-5 years before the system would become well and truly
overheated. This view strongly suggests further significant progress in earnings and
dividends in the years ahead.
revised up, but in typical modest fashion. SP 500 profits are expected to rise 47% in 2010
to around the $83.70 level reflecting about 8% sales growth and higher profit margins from
dramatic cost cutting. The bulk of the sales increase reflects higher unit volume, with pricing
power remaining modest. Higher profit margin is somewhat overstated by a rising level of
share buy ins as cash flow rises and companies gently increase underlying leverage and ROE%.
Analysts in sum now look for 2011 profits to rise to a record $94.80 per share, for a gain of
13.3%. Confidence in this good an increase is on the rise, in line with the recent improvement
in the economic indicators and further liberalization of fiscal and monetary policy. To do this
well in a continuing environment of modest pricing power, companies will again need to show
good volume gains and further operating efficiencies.
I am using a number around $90 a share for SP 500 eps in 2011. That would represent a 7.5%
increase over the current estimate for 2010. I am using the more conservative figure because
I am not as yet willing to make more generous growth assumptions beyond mid 2011, when
the Fed must again make another decision regarding quantitative easing. Moreover, I want
time to assess to what extent companies are willing to increase hiring and whether the
markets for private sector shorter term credit will begin to loosen up.
I continue to think there is ample slack in the US economy and that recovery / expansion
can easily proceed for another 4-5 years before the system would become well and truly
overheated. This view strongly suggests further significant progress in earnings and
dividends in the years ahead.
Sunday, December 26, 2010
Stock Market -- Caution Light
The bull run in place since late Aug. remains intact. But, it is getting overbought on an
intermediate term basis against the 13 week m/a and the 12 week RSI. Moreover, it is
extended on the 14 week stochastic momentum measure. SP 500 chart. As well, the CBOE
weekly individual stock put to call ratio is at a low 50.5 average for the past four weeks.
That is not just very bullish sentiment, it is heavy betting on a rising market that is usually not
rewarded at such aggressive levels of short term speculation.
These warnings suggest the market is likely to pull back some over the next 10 trading days
and hardly signal a major turn of events on their own. But the market has put in a solid 17
weeks without major upset and it only seems fitting that it would stiff the optimists at some
point over the next couple of weeks.
intermediate term basis against the 13 week m/a and the 12 week RSI. Moreover, it is
extended on the 14 week stochastic momentum measure. SP 500 chart. As well, the CBOE
weekly individual stock put to call ratio is at a low 50.5 average for the past four weeks.
That is not just very bullish sentiment, it is heavy betting on a rising market that is usually not
rewarded at such aggressive levels of short term speculation.
These warnings suggest the market is likely to pull back some over the next 10 trading days
and hardly signal a major turn of events on their own. But the market has put in a solid 17
weeks without major upset and it only seems fitting that it would stiff the optimists at some
point over the next couple of weeks.
Friday, December 24, 2010
Natural Gas Price
Last autumn, when natural gas fell below $3.00 mcf, I posted that it my might be worth more
work to get up to speed on it. There was a rally, but I did little in the way of follow-up. Since
the autumn rally, gas has fallen into another bearish funk. I still think gas is interesting, as it
is now trading just above $4.00, which is a pennies premium over all-in production costs.
Natural gas was in a powerful bull market over much of the first half of this decade, as solid
fundamentals allowed it to piggy back on the strong upswing in the oil price. With hurricanes
Katrina and Rita hitting the La. - Tx gas hubs in 2005, gas surged to a crazy $14.+ momentum
driven peak in 2005. It made a secondary top of around $13.60 in the commodities blow off
of 2008 before crashing down to $2.90 during Sep. 2009.
Natural gas demand was on the flat side over the past decade, while production rose about
10%. With a rising price trend, exploration increased and proven reserves surged 67% and
is closing in on the old record set years ago. The 2007-09 recession punished demand as new
supplies came on, leading to a large 12% increase in carry stock or stored supply. With this
new and upward trending inventory overhang, the price has remained suppressed over the
past two years. The adjustment process has been extended because shutting in gas wells
is a costly, time consuming and tedious process.
With an economy that is continuing to recover and normal weather, consumption should
rise and the inventory overhang should dissipate over the next two to three years, although
inventory will remain near historically high levels.
With gas having a strong reserve position and with new technologies at work to produce
greater supply such as shale gas, there is no explosive pricing story here. But, smart
companies like Exxon are bypassing oil properties to develop gas reserves, and that also
means the industry will be pressing to find ways to boost gas consumption through fluids
conversion and other technologies. Gas is cheap relative to oil, but the key here is to find
practical ways to boost its utility.
Gas players who have bought contracts around $4.00 over the past decade have had the
opportunity to profit each time out. Holding gas above $8.00 mcf has not worked out well
save for the Katrina and commodities price spikes of 2005 and 2008, respectively.
Continuing economic recovery and better inventory control would support a central $4.00 -
$8.00 range over the next couple of years. Moreover, if smart guys like Exxon want to own
more gas, it may be worth thinking about.
Ahead, I want to look at UNG, the direct ETF type participation in gas.
$NATGAS chart.
work to get up to speed on it. There was a rally, but I did little in the way of follow-up. Since
the autumn rally, gas has fallen into another bearish funk. I still think gas is interesting, as it
is now trading just above $4.00, which is a pennies premium over all-in production costs.
Natural gas was in a powerful bull market over much of the first half of this decade, as solid
fundamentals allowed it to piggy back on the strong upswing in the oil price. With hurricanes
Katrina and Rita hitting the La. - Tx gas hubs in 2005, gas surged to a crazy $14.+ momentum
driven peak in 2005. It made a secondary top of around $13.60 in the commodities blow off
of 2008 before crashing down to $2.90 during Sep. 2009.
Natural gas demand was on the flat side over the past decade, while production rose about
10%. With a rising price trend, exploration increased and proven reserves surged 67% and
is closing in on the old record set years ago. The 2007-09 recession punished demand as new
supplies came on, leading to a large 12% increase in carry stock or stored supply. With this
new and upward trending inventory overhang, the price has remained suppressed over the
past two years. The adjustment process has been extended because shutting in gas wells
is a costly, time consuming and tedious process.
With an economy that is continuing to recover and normal weather, consumption should
rise and the inventory overhang should dissipate over the next two to three years, although
inventory will remain near historically high levels.
With gas having a strong reserve position and with new technologies at work to produce
greater supply such as shale gas, there is no explosive pricing story here. But, smart
companies like Exxon are bypassing oil properties to develop gas reserves, and that also
means the industry will be pressing to find ways to boost gas consumption through fluids
conversion and other technologies. Gas is cheap relative to oil, but the key here is to find
practical ways to boost its utility.
Gas players who have bought contracts around $4.00 over the past decade have had the
opportunity to profit each time out. Holding gas above $8.00 mcf has not worked out well
save for the Katrina and commodities price spikes of 2005 and 2008, respectively.
Continuing economic recovery and better inventory control would support a central $4.00 -
$8.00 range over the next couple of years. Moreover, if smart guys like Exxon want to own
more gas, it may be worth thinking about.
Ahead, I want to look at UNG, the direct ETF type participation in gas.
$NATGAS chart.
Tuesday, December 21, 2010
Oil Price
Over the period from mid 2002 through mid 2008, global oil consumption rose steadily and
excess production capacity fell sharply. The oil price accelerated dramatically up as excess
production capacity was drawn down to extremely low levels. So, the world wound up with
an oil price bubble and subsequent crash as global oil consumption fell sharply once worldwide
recession developed. The demand contraction drove a growing legion of financial "round trip"
players out of the market.
Oil demand stabilized in latter 2009 and rose this year. It should rise again in 2011, but perhaps
more moderately as inventories have remained at high levels after the desperate scramble for
crude in 2008. There is now a substantial cushion of excess or shut in capacity at the well head.
The cost of oil extraction has risen substantially on new production during the past decade, and
this has raised the equilibrium price of crude substantially. My number for the equilibrium price
is $58. bl. Most industry specialists would peg the price at around $70.
The oil price, which fell to a little above $30. bl. in the 2008 price crash, rose to the accepted
equilibrium price of $70. by mid 2009 on speculation demand would recover in succeeding
periods. The upward price momentum of the oil price has cooled substantially since it recovered
to $70. After all, there is now a much larger spare capacity cushion and supplies in storage
are very much higher now than in early 2008 when the accumulation scramble started.
The volatility of the oil price has toned down substantially over the past 18 months. It is
currently enjoying a counter-seasonal run up as players have jumped in to position ahead
of the normal seasonal rise in price over the winter months as gasoline stocks are built.
With oil consumption set to rise further through 2011, I am merely guessing a range for the
year of $75. - $110. bl. The current price of $89. is slightly overbought. One thing to
watch for next year is whether the oil price uptrend is passed quickly through to gasoline
prices as has been happening recently. Such a development could lead consumers to
re-allocate budget commitments away from other consumer items.
Oil $ chart.
excess production capacity fell sharply. The oil price accelerated dramatically up as excess
production capacity was drawn down to extremely low levels. So, the world wound up with
an oil price bubble and subsequent crash as global oil consumption fell sharply once worldwide
recession developed. The demand contraction drove a growing legion of financial "round trip"
players out of the market.
Oil demand stabilized in latter 2009 and rose this year. It should rise again in 2011, but perhaps
more moderately as inventories have remained at high levels after the desperate scramble for
crude in 2008. There is now a substantial cushion of excess or shut in capacity at the well head.
The cost of oil extraction has risen substantially on new production during the past decade, and
this has raised the equilibrium price of crude substantially. My number for the equilibrium price
is $58. bl. Most industry specialists would peg the price at around $70.
The oil price, which fell to a little above $30. bl. in the 2008 price crash, rose to the accepted
equilibrium price of $70. by mid 2009 on speculation demand would recover in succeeding
periods. The upward price momentum of the oil price has cooled substantially since it recovered
to $70. After all, there is now a much larger spare capacity cushion and supplies in storage
are very much higher now than in early 2008 when the accumulation scramble started.
The volatility of the oil price has toned down substantially over the past 18 months. It is
currently enjoying a counter-seasonal run up as players have jumped in to position ahead
of the normal seasonal rise in price over the winter months as gasoline stocks are built.
With oil consumption set to rise further through 2011, I am merely guessing a range for the
year of $75. - $110. bl. The current price of $89. is slightly overbought. One thing to
watch for next year is whether the oil price uptrend is passed quickly through to gasoline
prices as has been happening recently. Such a development could lead consumers to
re-allocate budget commitments away from other consumer items.
Oil $ chart.
Sunday, December 19, 2010
CRB Commodity Price Composite
The CRB - Jefferies commodites composite will enter 2011 with a cycle bull market intact.
It could even receive an extra kick in Q1 '11 if winter weather in the northern hemisphere
continues cold and snowy and if China does not accelerate credit tightening, which would
allow for normal seasonal stocking there.
However, the market is overbought, and as the linked-to chart shows, has exhibited fairly
strong discipline when it gets at a sharp premium to the 40 week m/a, as it is now. It will
be instructive to see how well the discipline holds up near term. $CRB chart.
It could even receive an extra kick in Q1 '11 if winter weather in the northern hemisphere
continues cold and snowy and if China does not accelerate credit tightening, which would
allow for normal seasonal stocking there.
However, the market is overbought, and as the linked-to chart shows, has exhibited fairly
strong discipline when it gets at a sharp premium to the 40 week m/a, as it is now. It will
be instructive to see how well the discipline holds up near term. $CRB chart.
Saturday, December 18, 2010
Stock Market -- 2011
My primary fundamentals are positive and improving as we approach 2011. However, I am
more curious than bullish about the year ahead. My SP 500 Market Tracker -- based on a
long term model that derives a p/e ratio based on inflation -- indicates the market should close
out 2010 around 1370. The "500" closed on Fri. 12/17 at 1244, so even if there is a "Santa
Claus" rally, the market is likely to finish the year well below the indicated fair value. So, for
me, this represents a big miss as I had no argument with the 1370 number at the outset of the
year.
When the model fails, it is often because the earnings expectation is wrong. A failure of this
sort is easy to adjust as a year wears on, because the earnings indicators start suggesting that the
estimate is too high or too low. It is much tougher to analyze a miss well when it is the p/e
ratio implied by the model that goes wrong. Such is what happened in 2010. I used a multiple
of 16.5x, when it looks like 15.0x would have been the better number.
Having too high a p/e in this case did reflect the very weak growth in my broader measure
of financial liquidity as well as an underlying sense of investor caution about the poor
balance the economy showed between business sales growth, which was good, and the
growth of employment which was very lacklustre over the second half of the year. In my
view, the decision by so many companies to max out profit margin in preference to adding
more staff and conducting normal working capital financing may have resulted in
the punched up earnings being accorded a lower multiple as investors were left to wonder
who would buy the higher output if employment is stagnating.
The Market Tracker has the SP 500 going to 1470 by the end of 2011. However, rather
than make a specific projection for 2011, I am going to be content to see how cautious
investors remain next year, and adjust my thinking as the year goes along. Ditto liquidity
growth, which, as of today is only visible through mid 2011 on the strength of the Fed's
current round of quantitative easing.
more curious than bullish about the year ahead. My SP 500 Market Tracker -- based on a
long term model that derives a p/e ratio based on inflation -- indicates the market should close
out 2010 around 1370. The "500" closed on Fri. 12/17 at 1244, so even if there is a "Santa
Claus" rally, the market is likely to finish the year well below the indicated fair value. So, for
me, this represents a big miss as I had no argument with the 1370 number at the outset of the
year.
When the model fails, it is often because the earnings expectation is wrong. A failure of this
sort is easy to adjust as a year wears on, because the earnings indicators start suggesting that the
estimate is too high or too low. It is much tougher to analyze a miss well when it is the p/e
ratio implied by the model that goes wrong. Such is what happened in 2010. I used a multiple
of 16.5x, when it looks like 15.0x would have been the better number.
Having too high a p/e in this case did reflect the very weak growth in my broader measure
of financial liquidity as well as an underlying sense of investor caution about the poor
balance the economy showed between business sales growth, which was good, and the
growth of employment which was very lacklustre over the second half of the year. In my
view, the decision by so many companies to max out profit margin in preference to adding
more staff and conducting normal working capital financing may have resulted in
the punched up earnings being accorded a lower multiple as investors were left to wonder
who would buy the higher output if employment is stagnating.
The Market Tracker has the SP 500 going to 1470 by the end of 2011. However, rather
than make a specific projection for 2011, I am going to be content to see how cautious
investors remain next year, and adjust my thinking as the year goes along. Ditto liquidity
growth, which, as of today is only visible through mid 2011 on the strength of the Fed's
current round of quantitative easing.
Thursday, December 16, 2010
Stock Market & Financial Liquidity
Measured in 12 month intervals the US economic recovery has been at a far faster pace than
has the growth of my broad financial liquidity composite since late 2009. The resulting liquidity
"deficit" primarily reflects the shrinkage of private sector credit demand which has reduced the
need for funds in the system. This has created a headwind for stocks. This headwind has eased
substantially since the spring of this year, but it remains appreciable. Looking forward, the
decision by the Fed to buy an additional $600 bil. of Treasuries through mid 2011 will ease
the strain on the broad measure of financial liquidity, which increased by a tiny 1.2 % yr/yr
through 11/10 (and was essentially flat adjusted for inflation). But that $600 bil. pool will
be subject to claims by the real economy as well as the capital markets, so contrary to what
a number of commentators have said, it's not all gravy for the capital markets or the inflation
rate, for that matter.
The leading economic indicators point to a continuing acceleration of the pace of economic
recovery in the months ahead. Moreover, inventory investment by business, which badly
lagged the economy during most of the current recovery, has been catching up. Now, the
recovery of business sales and continued cost cutting has provided a sizable surge of
business sector cash flow which has been more than sufficient to fund expanding working
capital requirements, and, we will have to see whether rising new order books can
continue to be funded internally or whether business will need to increase shorter term
borrowing for working capital and to invest more in adding new workers.
Increased business borrowing would add credit based liquidity to the system, and that
would, other things held equal, diminish further the headwind the stock market faces.
Naturally, this more normal funding activity would come at a cost down the road in the
form of higher short term interest rates. But since rates are so low, the stock market
can accomodate the early phase of rising rates.
Investor caution and the liquidity headwind the stock market faces have trimmed 1.5
points off the p/e multiple based on 2010 earnings by my reckoning. We shall have the
headwind in place as we move into 2011.
has the growth of my broad financial liquidity composite since late 2009. The resulting liquidity
"deficit" primarily reflects the shrinkage of private sector credit demand which has reduced the
need for funds in the system. This has created a headwind for stocks. This headwind has eased
substantially since the spring of this year, but it remains appreciable. Looking forward, the
decision by the Fed to buy an additional $600 bil. of Treasuries through mid 2011 will ease
the strain on the broad measure of financial liquidity, which increased by a tiny 1.2 % yr/yr
through 11/10 (and was essentially flat adjusted for inflation). But that $600 bil. pool will
be subject to claims by the real economy as well as the capital markets, so contrary to what
a number of commentators have said, it's not all gravy for the capital markets or the inflation
rate, for that matter.
The leading economic indicators point to a continuing acceleration of the pace of economic
recovery in the months ahead. Moreover, inventory investment by business, which badly
lagged the economy during most of the current recovery, has been catching up. Now, the
recovery of business sales and continued cost cutting has provided a sizable surge of
business sector cash flow which has been more than sufficient to fund expanding working
capital requirements, and, we will have to see whether rising new order books can
continue to be funded internally or whether business will need to increase shorter term
borrowing for working capital and to invest more in adding new workers.
Increased business borrowing would add credit based liquidity to the system, and that
would, other things held equal, diminish further the headwind the stock market faces.
Naturally, this more normal funding activity would come at a cost down the road in the
form of higher short term interest rates. But since rates are so low, the stock market
can accomodate the early phase of rising rates.
Investor caution and the liquidity headwind the stock market faces have trimmed 1.5
points off the p/e multiple based on 2010 earnings by my reckoning. We shall have the
headwind in place as we move into 2011.
Tuesday, December 14, 2010
1) Stock Market Quickie 2) Monetary Policy Quickie
Stock Market
The SP 500 made a new cyclical high near 1242 today, but NYSE breadth and my buying
pressure gauge are not confirming this high. The NYSE TRIN index did show strong
buying pressure over the past two weeks, but the non-confirmation of breadth suggests
there are sectors and issues that are overbought and are holding back the broad market.
Watch carefully in the days just ahead.
Monetary Policy
I'll skip doing a FOMC wrap since such will be all over the web. But I did want to note that
my interest rate policy gauge has slipped from a 50% chance the Fed will raise rates soon down
to 25% on a weakening of non financial commercial paper activity. Now, although both short
term business credit demand gauges are now negative, they are in basing and bottoming patterns.
Thus, if the economy broadens in recovery momentum beyond stronger retail sales in the
months ahead, we'll need to see if business credit demand reverses to the upside. Make a note,
as such developments would likely wind up giving me a reading of 75% in favor of raising
short rates and set off Street chatter that the Fed is falling behind the curve.
The SP 500 made a new cyclical high near 1242 today, but NYSE breadth and my buying
pressure gauge are not confirming this high. The NYSE TRIN index did show strong
buying pressure over the past two weeks, but the non-confirmation of breadth suggests
there are sectors and issues that are overbought and are holding back the broad market.
Watch carefully in the days just ahead.
Monetary Policy
I'll skip doing a FOMC wrap since such will be all over the web. But I did want to note that
my interest rate policy gauge has slipped from a 50% chance the Fed will raise rates soon down
to 25% on a weakening of non financial commercial paper activity. Now, although both short
term business credit demand gauges are now negative, they are in basing and bottoming patterns.
Thus, if the economy broadens in recovery momentum beyond stronger retail sales in the
months ahead, we'll need to see if business credit demand reverses to the upside. Make a note,
as such developments would likely wind up giving me a reading of 75% in favor of raising
short rates and set off Street chatter that the Fed is falling behind the curve.
Sunday, December 12, 2010
Financial System Liquidity
We are now nearly 18 months into a US economic recovery, and the loan book of the banknig
system continues to contract. By post WW2 standards, this is a truly extraordinary story,
although it is an understandable one given the depth and duration of the preceding recession.
At its peak in Half 2 '08, the system's loan book was about $1.5 tril. or 8.2% over the long term
growth trend. It is now only $220 bil. or 3% above the long term trend. The system is still
carrying loan loss reserves in excess of $200 bil., and there has been but modest improvement
in the ratio of nonperforming loans to total loans. There is ample liquidity on the system's
balance sheet and lending standards are starting to be relaxed. However, the banks are behaving
with great caution.
Consequently, the boad measure of system liquidity to include the basic money supply and
primary funding tools has incresed only slightly from it's recession trough and remains a bit
below the historic peak seen in late 2008. This is true despite the very large injections of
liquidity by the Fed ($1.5 tril.) to stabilize and grow the system since latter 2008.
From my perspective, the recovery has primarily been a "cash and carry" affair, with the
Fed's large liquidity infusions being the lifeline for the recovery.
With system cash and checkables accounting for only 16% of the broad measure of cash plus
the broader array of deposits and funding vehicles like commercial paper, the burden on the
Fed to supply supporting liquidity is enormous.
We are very much in the kind of situation the Fed and the economy faced in the years
after the Great Depression trough, when private sector credit availability was contracting.
Then as now, there is pent up demand for goods and services, but the very narrow base
of liquidity expansion reduces the visibility of growth nonetheless, and, with the Fed serving
as the main game in town, confidence stays restrained.
The consumer has begun to loosen up and spend more here in the closing months of 2010,
and now time is at hand for business and the banks to respond more positively with jobs,
investment and credit.
system continues to contract. By post WW2 standards, this is a truly extraordinary story,
although it is an understandable one given the depth and duration of the preceding recession.
At its peak in Half 2 '08, the system's loan book was about $1.5 tril. or 8.2% over the long term
growth trend. It is now only $220 bil. or 3% above the long term trend. The system is still
carrying loan loss reserves in excess of $200 bil., and there has been but modest improvement
in the ratio of nonperforming loans to total loans. There is ample liquidity on the system's
balance sheet and lending standards are starting to be relaxed. However, the banks are behaving
with great caution.
Consequently, the boad measure of system liquidity to include the basic money supply and
primary funding tools has incresed only slightly from it's recession trough and remains a bit
below the historic peak seen in late 2008. This is true despite the very large injections of
liquidity by the Fed ($1.5 tril.) to stabilize and grow the system since latter 2008.
From my perspective, the recovery has primarily been a "cash and carry" affair, with the
Fed's large liquidity infusions being the lifeline for the recovery.
With system cash and checkables accounting for only 16% of the broad measure of cash plus
the broader array of deposits and funding vehicles like commercial paper, the burden on the
Fed to supply supporting liquidity is enormous.
We are very much in the kind of situation the Fed and the economy faced in the years
after the Great Depression trough, when private sector credit availability was contracting.
Then as now, there is pent up demand for goods and services, but the very narrow base
of liquidity expansion reduces the visibility of growth nonetheless, and, with the Fed serving
as the main game in town, confidence stays restrained.
The consumer has begun to loosen up and spend more here in the closing months of 2010,
and now time is at hand for business and the banks to respond more positively with jobs,
investment and credit.
Friday, December 10, 2010
Stock Market Comment
Fundamental
The weekly cyclical fundamental market indicator remains in a firm uptrend off the 8/30/10
interim low and has been moving up faster than the SP 500. This result is partly a consequence
of investor preference for mid and smaller cap stocks as well as for selected foreign markets.
As well, investor confidence is lagging some, reflecting, I think, concerns about the weaker
credits in the EU and continued firming of China's monetary policy. On a weekly basis, the
correlation of the SP 500 to the cyclical indicator has dropped from +.7 down to +.64.
Technical
The market did break above resistance as the week wore on. We have new cyclical highs and
confirmation that the second upleg of this cyclical bull is intact. The shorter term uptrend has
been re-established, and I have the market as still mildly overbought.
SP 500 short term chart.
The weekly cyclical fundamental market indicator remains in a firm uptrend off the 8/30/10
interim low and has been moving up faster than the SP 500. This result is partly a consequence
of investor preference for mid and smaller cap stocks as well as for selected foreign markets.
As well, investor confidence is lagging some, reflecting, I think, concerns about the weaker
credits in the EU and continued firming of China's monetary policy. On a weekly basis, the
correlation of the SP 500 to the cyclical indicator has dropped from +.7 down to +.64.
Technical
The market did break above resistance as the week wore on. We have new cyclical highs and
confirmation that the second upleg of this cyclical bull is intact. The shorter term uptrend has
been re-established, and I have the market as still mildly overbought.
SP 500 short term chart.
Thursday, December 09, 2010
Treasury Bond Strategy Factors
Today's post builds upon yesterday's entry on the Long Treasury bond. Here I want to look at
strategy factors and the difficulties involved in devising workable strategies.
Long term interest rates are sensitive to the trend and level of short term rates. There are
effective models one can use to get a fair bead on where bond yields should be when short
term rates are at moderate levels. Such is not the case when short rates are at extreme levels.
There is an extreme now with the 91 day T-bill rate at just around 0.15%. Moreover, since the
Fed has no intention to raise short rates in the near term, there is not a solid model application
here for the bond. My very long term model for the level of short rates based on inflation
factors implies the T-bill should now be yielding about 3.0%. My very long term model
for deriving the long bond yield from the short rate says I should multiply the bill rate by 1.5x.
The model implies that the long Treas. should now be yielding 4.5% (3.0 x 1.5), which is
close to the present yield for the bond and which also suggests bond players are assuming
that short rates will eventually rise moderately. This hypothetical run-through is interesting
nonetheless.
To protect purchasing power, a bond needs to provide current return and re-investment of
interest received return which exceeds inflation by a meaningful degree. With the current
CPI running about 1.2% yr/yr, the old rule of thumb is to add 300 basis points to the CPI
reading to get get a fair yield for the T-bond. This informal model puts the "proper"
yield for the bond at 4.2%.
Another approach I have used in recent years is to deduct a 3% inflation assumption from
the yield on the 30 yr. T-bond. Experience shows the bond tends to rally in price when
there is nearly a 200 basis point premium over the 3% CPI assumption and to not do so
well when the premium is only 100 basis points or less. See chart. (Note too, the
sensitivity in yield to industrial commodities prices such GS's industrial metals composite).
There have been few periods in US history when the inflation rate has sustained above 5%
for an appreciable period. Mostly, these inflation surges have come around war time when
resources are heavily in demand. However, if you wanted to look out past a few years and
were concerned that inflation could average 3% for a sustained period, then my work
suggests the T-bond yield would have to rise to 6% before it offered decent value. And, it
will do precisely that on evidence of a sustainable acceleration of inflation pressure from
the present low level.
With a rise in the Treasury's funding requirements, bondholders should expect a premium
to be built into the long bond yield to cover a much heavier supply of new debt and a
higher level of re-funding. I do not see that yet, but if confidence grows further in other
riskier markets, it may appear and could add up to 100 basis points to the bond yield.
In summary, the T-bond is reasonably valued now given the low levels of short rates and
inflation. Obviously if the recovery continues to advance, broaden out more and solidify,
then it would be no stretch to the see the long Treas. move up to 5.25 - 5.50%.
strategy factors and the difficulties involved in devising workable strategies.
Long term interest rates are sensitive to the trend and level of short term rates. There are
effective models one can use to get a fair bead on where bond yields should be when short
term rates are at moderate levels. Such is not the case when short rates are at extreme levels.
There is an extreme now with the 91 day T-bill rate at just around 0.15%. Moreover, since the
Fed has no intention to raise short rates in the near term, there is not a solid model application
here for the bond. My very long term model for the level of short rates based on inflation
factors implies the T-bill should now be yielding about 3.0%. My very long term model
for deriving the long bond yield from the short rate says I should multiply the bill rate by 1.5x.
The model implies that the long Treas. should now be yielding 4.5% (3.0 x 1.5), which is
close to the present yield for the bond and which also suggests bond players are assuming
that short rates will eventually rise moderately. This hypothetical run-through is interesting
nonetheless.
To protect purchasing power, a bond needs to provide current return and re-investment of
interest received return which exceeds inflation by a meaningful degree. With the current
CPI running about 1.2% yr/yr, the old rule of thumb is to add 300 basis points to the CPI
reading to get get a fair yield for the T-bond. This informal model puts the "proper"
yield for the bond at 4.2%.
Another approach I have used in recent years is to deduct a 3% inflation assumption from
the yield on the 30 yr. T-bond. Experience shows the bond tends to rally in price when
there is nearly a 200 basis point premium over the 3% CPI assumption and to not do so
well when the premium is only 100 basis points or less. See chart. (Note too, the
sensitivity in yield to industrial commodities prices such GS's industrial metals composite).
There have been few periods in US history when the inflation rate has sustained above 5%
for an appreciable period. Mostly, these inflation surges have come around war time when
resources are heavily in demand. However, if you wanted to look out past a few years and
were concerned that inflation could average 3% for a sustained period, then my work
suggests the T-bond yield would have to rise to 6% before it offered decent value. And, it
will do precisely that on evidence of a sustainable acceleration of inflation pressure from
the present low level.
With a rise in the Treasury's funding requirements, bondholders should expect a premium
to be built into the long bond yield to cover a much heavier supply of new debt and a
higher level of re-funding. I do not see that yet, but if confidence grows further in other
riskier markets, it may appear and could add up to 100 basis points to the bond yield.
In summary, the T-bond is reasonably valued now given the low levels of short rates and
inflation. Obviously if the recovery continues to advance, broaden out more and solidify,
then it would be no stretch to the see the long Treas. move up to 5.25 - 5.50%.
Wednesday, December 08, 2010
Long Treasury Bond
In posts dated 8/19/10 and 8/24/10, I argued that the long bond was strongly overbought and
that it was overdiscounting a presumably weaker economic environment. I stated that the $USB
which was trading around 135 could lose up to 20 price points in a correction, and warned that
with large pools of fast money such as hedge funds in the market, change could be fast and
dramatic when it came. Well, today the future is trading around 121.8 in a downtrending market.
The market is now oversold, but since major support lies down around 115, one needs to be
careful $USB.
The sharp reversal in the market reflects several factors. Shorter run leading economic
indicators turned positive in late Aug. and, consumer spending has strengthened. The Fed's
commitment to a quantitative easing of monetary policy gives concern to Treasury players
that economic growth potential may be enhanced. Inflation pressurge gauges have started to
rise here in the autumn, and finally, an outline of a "tax deal" between Pres. Obama and
congressional GOP leaders contains modest additional stimulus which would aid the
the economy but boost the budget deficit as well.
the long Treasury yield has been anchored by a near zero 91-day T bill yield and a volatile
but low inflation rate. Seasoned bond players know that as an economic recovery progresses,
inflation pressures eventually build as does credit demand. The normal response of the Fed
is to cite inflation pressure and raise short term interest rates. There is little risk the Fed will
so respond in the months straight ahead, but a firming economy can bring more inflation
pressure and sour bond players on the bond even so.
The long Treasury has moved into oversold territory on both technical and fundamental
grounds. However, the long bond could easily fall to $115 support and the yield could
easily rise to 4.85% resistance in an environment of firming production and rising
sensitive materials prices even as the Fed sits on its hands. There is not enough of an
extreme yet in the market level or in sentiment to warrant more than a long side trade
for an interval too short to suit my taste. I would also point out that bond players tend to
close their books for the year by mid-Dec., so liquidity in the market gets very thin.
I would suggest that should the long Treasury yield move up to and through the 4.80%
level, there would be a rather preliminary indication that the 30 year long bull market
in bonds could finally be winding up. Although such a development could trigger a torrent
of bearish commentary on investment sites, best to remember that a number of other
pieces of the puzzle would have to fall into place to legitimize the claim that the bull is
done.
Long Treasury Yield.
that it was overdiscounting a presumably weaker economic environment. I stated that the $USB
which was trading around 135 could lose up to 20 price points in a correction, and warned that
with large pools of fast money such as hedge funds in the market, change could be fast and
dramatic when it came. Well, today the future is trading around 121.8 in a downtrending market.
The market is now oversold, but since major support lies down around 115, one needs to be
careful $USB.
The sharp reversal in the market reflects several factors. Shorter run leading economic
indicators turned positive in late Aug. and, consumer spending has strengthened. The Fed's
commitment to a quantitative easing of monetary policy gives concern to Treasury players
that economic growth potential may be enhanced. Inflation pressurge gauges have started to
rise here in the autumn, and finally, an outline of a "tax deal" between Pres. Obama and
congressional GOP leaders contains modest additional stimulus which would aid the
the economy but boost the budget deficit as well.
the long Treasury yield has been anchored by a near zero 91-day T bill yield and a volatile
but low inflation rate. Seasoned bond players know that as an economic recovery progresses,
inflation pressures eventually build as does credit demand. The normal response of the Fed
is to cite inflation pressure and raise short term interest rates. There is little risk the Fed will
so respond in the months straight ahead, but a firming economy can bring more inflation
pressure and sour bond players on the bond even so.
The long Treasury has moved into oversold territory on both technical and fundamental
grounds. However, the long bond could easily fall to $115 support and the yield could
easily rise to 4.85% resistance in an environment of firming production and rising
sensitive materials prices even as the Fed sits on its hands. There is not enough of an
extreme yet in the market level or in sentiment to warrant more than a long side trade
for an interval too short to suit my taste. I would also point out that bond players tend to
close their books for the year by mid-Dec., so liquidity in the market gets very thin.
I would suggest that should the long Treasury yield move up to and through the 4.80%
level, there would be a rather preliminary indication that the 30 year long bull market
in bonds could finally be winding up. Although such a development could trigger a torrent
of bearish commentary on investment sites, best to remember that a number of other
pieces of the puzzle would have to fall into place to legitimize the claim that the bull is
done.
Long Treasury Yield.
Tuesday, December 07, 2010
Stock Market -- Short Term Technical
This one will be a quickie. The minor run-up in the market so far in Dec. has not yet
been strong enough to offer much to get excited about. The rally came off a mild oversold
and is encountering resistance at a mild short term overbought level. A continuation of the
upleg off the Aug. EOM lows should have more upside zip than has yet been exhibited.
The SP 500, which closed today at around 1224, should have no trouble moving right on
up to the 1250 level if this is going to be a solid upleg continuation and not a head fake.
I have linked to the "500" chart below and at the bottom of the chart is a panel showing the
% of stocks within the index that are trading above their respective 200 day moving averages.
When this index tops 80%, it normally signifies a higher degree of risk in the market, although
during powerful run-ups in stock prices, the % above the 200 day m/a can remain elevated
for extended periods. Even so, players should recognize that the market's risk level has moved
up since the summer.
SP 500 chart.
been strong enough to offer much to get excited about. The rally came off a mild oversold
and is encountering resistance at a mild short term overbought level. A continuation of the
upleg off the Aug. EOM lows should have more upside zip than has yet been exhibited.
The SP 500, which closed today at around 1224, should have no trouble moving right on
up to the 1250 level if this is going to be a solid upleg continuation and not a head fake.
I have linked to the "500" chart below and at the bottom of the chart is a panel showing the
% of stocks within the index that are trading above their respective 200 day moving averages.
When this index tops 80%, it normally signifies a higher degree of risk in the market, although
during powerful run-ups in stock prices, the % above the 200 day m/a can remain elevated
for extended periods. Even so, players should recognize that the market's risk level has moved
up since the summer.
SP 500 chart.
Friday, December 03, 2010
Economic Indicators
Both weekly and monthly leading indicators remain in uptrends which did restart in the
latter part of Aug. The linearity between most of these series and eventual economic
performance has declined primarily reflecting the increased volatility of sensitive materials
prices. In sum, though, a re-acceleration of both US and global economic recovery is
indicated.
Weekly and monthly coincident indicators have also turned up since Oct. following an
extended flat period running back to Jul.
The slowdown of economic growth experienced over the late spring and summer of this
year lead initially to a flattening of total US civilian employment followed by weakness
in both Oct. and Nov. As a consequence, the unemployment rate has moved back up to the
9.8% level. The combination of nominal real wage growth and a weaker employment
picture over the past six months has substantially undercut the visibility for continued
economic recovery in the US. The recent decision by the Fed to accelerate the growth of
monetary liquidity and fresh life to the leading economic indicators are welcome
developments as is the faster growth of retail sales in recent months. However, if business
remains reluctant to hire and continues content simply to reap gains from a lower cost
structure, the odds that the economy will eventually sputter and cease recovering will
inevitably rise significantly as 2011 wears on. Ditto the banks, which are experiencing
a rising trend of earnings from a drop off in loan loss reserving as opposed to profits
gained from an expanding loan book.
latter part of Aug. The linearity between most of these series and eventual economic
performance has declined primarily reflecting the increased volatility of sensitive materials
prices. In sum, though, a re-acceleration of both US and global economic recovery is
indicated.
Weekly and monthly coincident indicators have also turned up since Oct. following an
extended flat period running back to Jul.
The slowdown of economic growth experienced over the late spring and summer of this
year lead initially to a flattening of total US civilian employment followed by weakness
in both Oct. and Nov. As a consequence, the unemployment rate has moved back up to the
9.8% level. The combination of nominal real wage growth and a weaker employment
picture over the past six months has substantially undercut the visibility for continued
economic recovery in the US. The recent decision by the Fed to accelerate the growth of
monetary liquidity and fresh life to the leading economic indicators are welcome
developments as is the faster growth of retail sales in recent months. However, if business
remains reluctant to hire and continues content simply to reap gains from a lower cost
structure, the odds that the economy will eventually sputter and cease recovering will
inevitably rise significantly as 2011 wears on. Ditto the banks, which are experiencing
a rising trend of earnings from a drop off in loan loss reserving as opposed to profits
gained from an expanding loan book.
Thursday, December 02, 2010
Energy Sector
Back on 10/15, I mentioned that the energy sector stock group was starting to reverse a decline
in relative strength in place since the bursting of the oil price bubble in mid 2008. I mentioned
several factors to account for the positive turn: The oil price has resumed a positive trend
following a sharp pullback over Apr. / May 2010. The natural gas price is building a base after
a huge price decline from mid 2008 through Aug. '09. These two factors in a recovering global
economy provide the basis for a positive turn in earnings for the industry. As well, continued
recovery will eventually return increased pricing power for oil especially as capacitiy
utilization at the wellhead rises. Thus, the sector may be expected to offer relative strength in
earnings, too.
When there is a sharply positive turn in relative strength for a sector against the broad stock
market following a significant period of decline, it is well worth notice especially if the
positive movement in relative strength is appreciable. This means investors are changing their
outlook quickly with some zeal and are doing re-positioning in favor of the group.
One caveat: The XLE energy sector is a market leader now but is coming up on a short term
overbought situation. XLE
in relative strength in place since the bursting of the oil price bubble in mid 2008. I mentioned
several factors to account for the positive turn: The oil price has resumed a positive trend
following a sharp pullback over Apr. / May 2010. The natural gas price is building a base after
a huge price decline from mid 2008 through Aug. '09. These two factors in a recovering global
economy provide the basis for a positive turn in earnings for the industry. As well, continued
recovery will eventually return increased pricing power for oil especially as capacitiy
utilization at the wellhead rises. Thus, the sector may be expected to offer relative strength in
earnings, too.
When there is a sharply positive turn in relative strength for a sector against the broad stock
market following a significant period of decline, it is well worth notice especially if the
positive movement in relative strength is appreciable. This means investors are changing their
outlook quickly with some zeal and are doing re-positioning in favor of the group.
One caveat: The XLE energy sector is a market leader now but is coming up on a short term
overbought situation. XLE
Wednesday, December 01, 2010
Stock Market -- Short Term Technical
The recent sell off eliminated the overbought. I did not like the idea of calling for a correction
without a clear cut break of shorter term trend. The market bent down but did not break.
Today was akin to a do or die day to determine whether the market was set to break down
and head sharply lower. Lo, and behold, we get a dramatic 2% up day instead, which reverses
the nascent downtrend and leaves the market in neutral territory.
The chart link below shows a series of tests of support for the SP 500 around the 1180 area
followed by today's big bounce. This is an encouraging sign for the bulls, and if the market was
coming off a deep oversold, I would be even more encouraged. However, there was no
deep oversold, just some volatility around a very mild oversold.
I would then be looking for positive follow through. I would like to see the 10 day m/a, which
reversed up today, rise through the 25 day m/a and for the 25 day m/a to hold up as well.
Today was an impressive move up from well tested short term support, but since it may just
represent a sudden short squeeze, I think it's fair to ask for more upside here, especially
since the market is hardly overbought and could easily run another 4-5% if the upleg which
started at the end of Aug. is truly set to resume.
$SPX
without a clear cut break of shorter term trend. The market bent down but did not break.
Today was akin to a do or die day to determine whether the market was set to break down
and head sharply lower. Lo, and behold, we get a dramatic 2% up day instead, which reverses
the nascent downtrend and leaves the market in neutral territory.
The chart link below shows a series of tests of support for the SP 500 around the 1180 area
followed by today's big bounce. This is an encouraging sign for the bulls, and if the market was
coming off a deep oversold, I would be even more encouraged. However, there was no
deep oversold, just some volatility around a very mild oversold.
I would then be looking for positive follow through. I would like to see the 10 day m/a, which
reversed up today, rise through the 25 day m/a and for the 25 day m/a to hold up as well.
Today was an impressive move up from well tested short term support, but since it may just
represent a sudden short squeeze, I think it's fair to ask for more upside here, especially
since the market is hardly overbought and could easily run another 4-5% if the upleg which
started at the end of Aug. is truly set to resume.
$SPX
Saturday, November 27, 2010
Still Draggin' Dragon
I watch China's Shanghai stock market through the eyes of a Westerner, even though China's
capital controls keep the participation of offshore money in its market limited. The real
estate markets are the bigger plays in China, and I believe many of the locals use a rising
stock market as a stepping stone for capital accumulation to play the various real estate
sectors.
I downgraded the market early in the year because I felt faster rising wage and materials
costs would pressure corporate profit margins. However, indications are that with strong
productivity gains in tow, profits growth has remained healthy. The market has fared poorly
this year anyway. The p/e multiple has been contracting, and from a Westerner's perspective
this development reflects accelerating inflation in China as well as efforts by the gov. and the
PoBC to trim asset speculation and inflation via a tightening of monetary policy and of
capital flows.
Viewed longer term, I regard the Shanghai Composite (11/26 2872 close) as reasonable
at the 3000-3200 level. With China a high growth economy, I use a 10% compound return
off the extended late 1990s base of around 1100. As the chart link ahead shows, the market
has been exceptionally volatile and has not often traded neatly in line with a 10% price
progression ( long term SSEC chart).
The market did recently come out of a year long downtrend, but has been buffeted in recent
weeks by additional gradualist credit tightening moves by the gov. The market is in a short
term downtrend, but there is no clear signal yet that the downtrend will extend and deepen.
The market is trading very near trend support, so a critical moment for direction could be
at hand. It is very hard to call turns with this market and it is much better to be a trend
follower when trading (shorter term trend).
The inflation momentum that has built up in China is significant and could require further
tightening steps including more deposit rate increases before authorities decide they
can ease up some on the tightening reins.
capital controls keep the participation of offshore money in its market limited. The real
estate markets are the bigger plays in China, and I believe many of the locals use a rising
stock market as a stepping stone for capital accumulation to play the various real estate
sectors.
I downgraded the market early in the year because I felt faster rising wage and materials
costs would pressure corporate profit margins. However, indications are that with strong
productivity gains in tow, profits growth has remained healthy. The market has fared poorly
this year anyway. The p/e multiple has been contracting, and from a Westerner's perspective
this development reflects accelerating inflation in China as well as efforts by the gov. and the
PoBC to trim asset speculation and inflation via a tightening of monetary policy and of
capital flows.
Viewed longer term, I regard the Shanghai Composite (11/26 2872 close) as reasonable
at the 3000-3200 level. With China a high growth economy, I use a 10% compound return
off the extended late 1990s base of around 1100. As the chart link ahead shows, the market
has been exceptionally volatile and has not often traded neatly in line with a 10% price
progression ( long term SSEC chart).
The market did recently come out of a year long downtrend, but has been buffeted in recent
weeks by additional gradualist credit tightening moves by the gov. The market is in a short
term downtrend, but there is no clear signal yet that the downtrend will extend and deepen.
The market is trading very near trend support, so a critical moment for direction could be
at hand. It is very hard to call turns with this market and it is much better to be a trend
follower when trading (shorter term trend).
The inflation momentum that has built up in China is significant and could require further
tightening steps including more deposit rate increases before authorities decide they
can ease up some on the tightening reins.
Friday, November 26, 2010
The Koreas
The latest provocation from Kim IJ and son, an artillery and rocket attack on a primarily
residential SK border island, has created more than the usual amount of risk that incidents
on the peninsula usually do. One can hardly be sure, but Kim may want to foster a crisis
wherein Kim the younger can be portrayed as a hero to the folks in NK. In the meanwhile,
SK has upped the ante on retaliation for future attacks from the north, and the US has
dispatched a carrier attack group to the region. This area is infamous for mis-calculation
by the major parties including the US and China. The history of the Korean war shows
a pattern of legendary blunders that flowed from everyone often misreading the intentions
of their adversaries.
Since another attack from NK against SK is likely to trigger a retaliation of significant
consequence from SK, We can hope NK will have the good sense not to overplay its
hand, since there is little reason to believe further actions could easily be retrieved and
settled diplomatically.
The easy and shorter term way out of this standoff is for the US and SK simply to signal
they are willing to buy Kim and son off. But there could be severe political consequences
for both the SK gov. and the Obama administration if they were to do so right in the
wake of the recent incident, especially since SK's bluff has been decisively called.
The antagonists have bruted about in and around the peninsula without major damage to the
area for over 50 years now, so it is not unreasonable to expect that inaction ahead would
again lead to a dissipation of tensions. Let us hope papa Kim sees it the same way.
residential SK border island, has created more than the usual amount of risk that incidents
on the peninsula usually do. One can hardly be sure, but Kim may want to foster a crisis
wherein Kim the younger can be portrayed as a hero to the folks in NK. In the meanwhile,
SK has upped the ante on retaliation for future attacks from the north, and the US has
dispatched a carrier attack group to the region. This area is infamous for mis-calculation
by the major parties including the US and China. The history of the Korean war shows
a pattern of legendary blunders that flowed from everyone often misreading the intentions
of their adversaries.
Since another attack from NK against SK is likely to trigger a retaliation of significant
consequence from SK, We can hope NK will have the good sense not to overplay its
hand, since there is little reason to believe further actions could easily be retrieved and
settled diplomatically.
The easy and shorter term way out of this standoff is for the US and SK simply to signal
they are willing to buy Kim and son off. But there could be severe political consequences
for both the SK gov. and the Obama administration if they were to do so right in the
wake of the recent incident, especially since SK's bluff has been decisively called.
The antagonists have bruted about in and around the peninsula without major damage to the
area for over 50 years now, so it is not unreasonable to expect that inaction ahead would
again lead to a dissipation of tensions. Let us hope papa Kim sees it the same way.
Tuesday, November 23, 2010
Inflation Potential
Technically, the US is still in a price deflation phase. The CPI is recovering from its 12/08
cyclical low, but is still 0.6% below the all-time high of 220.0 set during 7/08. It will not
likely surpass the prior peak until 2011.
The CPI for the past 12 months is up but 1.2%. A higher fuels bill for the nation has been
largely offset by a continuing deceleration of price pressure for all items less foods / fuels.
The weak CPI performance largely reflects the fact that the US utilization of capacity and
labor, although improving, is still well below levels seen at this point during most
economic recoveries. Business and labor have little pricing power in the current
environment.
The broad measure of inflation potential I use has basically been flat since late 2009
after a strong bounce over most of last year. My inflation pressure gauge, which gives a
large weight to commodities prices and is usually a better short range indicator than
broader measures, has risen sharply in recent months on higher fuel and basic food
ingredients. So far, however, there has been little or no pass through of the recent rise
in fuel and food prices to the full CPI measure.
The inflation pressure gauge is in a firm uptrend off its early 2009 cycle low and with
further economic recovery in store for 2011, there is likely to be some degree of
acceleration in the progress of the CPI next year. Since there will still likely be a
fair amount of slack in the US economy by year's end 2011, it would appear wise not
to expect more than a moderate uptick in yr / yr inflation readings next year. I know that
looking at 2010, the CPI is going to come in lower than I originally thought by a fair
margin.
cyclical low, but is still 0.6% below the all-time high of 220.0 set during 7/08. It will not
likely surpass the prior peak until 2011.
The CPI for the past 12 months is up but 1.2%. A higher fuels bill for the nation has been
largely offset by a continuing deceleration of price pressure for all items less foods / fuels.
The weak CPI performance largely reflects the fact that the US utilization of capacity and
labor, although improving, is still well below levels seen at this point during most
economic recoveries. Business and labor have little pricing power in the current
environment.
The broad measure of inflation potential I use has basically been flat since late 2009
after a strong bounce over most of last year. My inflation pressure gauge, which gives a
large weight to commodities prices and is usually a better short range indicator than
broader measures, has risen sharply in recent months on higher fuel and basic food
ingredients. So far, however, there has been little or no pass through of the recent rise
in fuel and food prices to the full CPI measure.
The inflation pressure gauge is in a firm uptrend off its early 2009 cycle low and with
further economic recovery in store for 2011, there is likely to be some degree of
acceleration in the progress of the CPI next year. Since there will still likely be a
fair amount of slack in the US economy by year's end 2011, it would appear wise not
to expect more than a moderate uptick in yr / yr inflation readings next year. I know that
looking at 2010, the CPI is going to come in lower than I originally thought by a fair
margin.
Saturday, November 20, 2010
India
Thought I would pick up India going forward. I do have an e-audience out there. Moreover,
a couple of kids from India are in our local NFL betting pool. Thirdly, the Sensex stock index
is moving directionally with the US stock market, but with more brio. $BSE chart.
The $BSE is in a powerful cyclical bull market. It too has entered a second upleg phase and
recently touched its prior all time high before running into resistance and news of a juicy
scandal that runs up high politically. Hope my timing is good, given that the market is coming
off a strong overbought and is headed down to a sharp oversold, and, perhaps, a rendezvous
with obvious support at 18K.
My plan here is to start on the technical side of the market and gradually move along to the
fundamentals. Should be fun.
a couple of kids from India are in our local NFL betting pool. Thirdly, the Sensex stock index
is moving directionally with the US stock market, but with more brio. $BSE chart.
The $BSE is in a powerful cyclical bull market. It too has entered a second upleg phase and
recently touched its prior all time high before running into resistance and news of a juicy
scandal that runs up high politically. Hope my timing is good, given that the market is coming
off a strong overbought and is headed down to a sharp oversold, and, perhaps, a rendezvous
with obvious support at 18K.
My plan here is to start on the technical side of the market and gradually move along to the
fundamentals. Should be fun.
Thursday, November 18, 2010
Commodities Market
I have run across many web articles in which it is argued that we are in a long term bull
market in commodities driven by rising demand from China and the battery of emerging
and developing economies going against longer term supply constraints. I think the broad
commodities composites are reasonable, but there is no evidence at hand to date that the
world is witnessing a long term bull run in commodities. There was a strong market over
the 1971 - 81 period, and then another good one from 2002 through early 2008. However,
at its cyclical low in the latter part of 2008, the CRB commodities composite was just
slightly above cyclical low points seen as far back as the mid 1970s.
There has been a cyclical bull run in place since late 2008, when China initiated its massive
fiscal stimulus program. The first leg was a strong run and ran from 12/08 - 12/09. A new
upleg started in the spring of 2010 and remains in place, with positive diffusion measures
for the main categories. The CRB composite has been in a nearly 40 year trading range. It
is now reading around 300, and when it crosses above long term resistance of 280, it
generally does well, provided the global economy continues to expand. In fact, it can
experience upside blow-off periods late in an expansion cycle when supply/ demand
conditions are tight.
Commodities are sensitive to the leading economic indicators, and are especially
sensitive to monetary policy. Thus, the CRB has benefited from hype about the Fed's QE '2
program, but we have also seen a recent whipsaw when China again raised bank reserve
requirements and announced an interest in seeking tougher management of the rise of
inflation pressure it is encountering. China greatly desires to maintain relatively strong
growth, so it is doubtful they have entered crunch mode with their monetary policy.
The CRB is coming off a strong short term overbought. There is shorter term trend support
at 285, chart pattern support at 275, and longer term trend support at roughly 265.
CRB chart. I have included Goldman's agricultural composite along with the CRB chart.
Note how the "ags" have forced up the CRB since summer and remember that farm /
grain prices can be extremely volatile and be subject seasonal weakness in cold weather.
From a cyclical perspective, it is likely too early to try to top spot the CRB at this point.
market in commodities driven by rising demand from China and the battery of emerging
and developing economies going against longer term supply constraints. I think the broad
commodities composites are reasonable, but there is no evidence at hand to date that the
world is witnessing a long term bull run in commodities. There was a strong market over
the 1971 - 81 period, and then another good one from 2002 through early 2008. However,
at its cyclical low in the latter part of 2008, the CRB commodities composite was just
slightly above cyclical low points seen as far back as the mid 1970s.
There has been a cyclical bull run in place since late 2008, when China initiated its massive
fiscal stimulus program. The first leg was a strong run and ran from 12/08 - 12/09. A new
upleg started in the spring of 2010 and remains in place, with positive diffusion measures
for the main categories. The CRB composite has been in a nearly 40 year trading range. It
is now reading around 300, and when it crosses above long term resistance of 280, it
generally does well, provided the global economy continues to expand. In fact, it can
experience upside blow-off periods late in an expansion cycle when supply/ demand
conditions are tight.
Commodities are sensitive to the leading economic indicators, and are especially
sensitive to monetary policy. Thus, the CRB has benefited from hype about the Fed's QE '2
program, but we have also seen a recent whipsaw when China again raised bank reserve
requirements and announced an interest in seeking tougher management of the rise of
inflation pressure it is encountering. China greatly desires to maintain relatively strong
growth, so it is doubtful they have entered crunch mode with their monetary policy.
The CRB is coming off a strong short term overbought. There is shorter term trend support
at 285, chart pattern support at 275, and longer term trend support at roughly 265.
CRB chart. I have included Goldman's agricultural composite along with the CRB chart.
Note how the "ags" have forced up the CRB since summer and remember that farm /
grain prices can be extremely volatile and be subject seasonal weakness in cold weather.
From a cyclical perspective, it is likely too early to try to top spot the CRB at this point.
Tuesday, November 16, 2010
Financial System Liquidity & Stock Market
Let's take note of the status of financial system liquidity here at the outset of what is, in
prospect, another susbstantial round of money printing by the Federal Reserve.
My broad measure of financial liquidity is up a scant 4.5% over the prior two years. Of that
increase, 80% comes from a rise in currency and checkables. So, quantitative easing by the
Fed accounts for the vast bulk of the paltry gain in the total. Bank funding growth has been
sharply curbed by a nearly $1 tril. run-off in private sector shorter term credit demand and
there has been an outright $700 bil. collapse in the market for asset backed and finance co.
commercial paper. This degree of liquidation is unprecedented in the modern era.
The Fed waited through most of 2010 to see if a a rather moderate economic recovery
would trigger a rebound in private sector credit demand. It did not, and the Fed, concerned
about the sustainability of the recovery, opted to begin another large ($600 bil.) program
of quantitative easing to assure a significant measure of funding for the economy.
Whether they will actually need to buy the $600 bil. of Treasuries is an open question in
my book. The weekly leading indicators suggest the economy is set to regain faster growth
traction and if this occurs and credit demand responds in a more positive, normal fashion,
the Fed will have the option to consider slowing the printing press as credit demand takes
on its accustomed role in helping to drive the economy. If private sector caution continues
and households and businesses refrain from borrowing more, than the Fed will proceed
with its program through mid-2011. It will be up to the Fed to tackle the issue of finding
the "right" balance.
The stock market has been keenly cognizant of Fed balance sheet mangement activity over
the past 18 odd months. The last three substantial downdrafts in the stock market -- early
2009, mid 2009, and spring 2010 have all occurred during periods when the Fed was
temporarily shrinking its balance sheet. Likewise, the bull moves in the market over this
period have come when the Fed has been expanding its balance sheet, or has been
promising to. When credit demand is shrinking or is flat, investors know that the Fed is
the only game in town when it comes to providing liquidity to the system. In this regard,
I suspect that if credit demand does pick up, then equities players will become a little
less sensitive to the ups and downs of the Fed's balance sheet.
prospect, another susbstantial round of money printing by the Federal Reserve.
My broad measure of financial liquidity is up a scant 4.5% over the prior two years. Of that
increase, 80% comes from a rise in currency and checkables. So, quantitative easing by the
Fed accounts for the vast bulk of the paltry gain in the total. Bank funding growth has been
sharply curbed by a nearly $1 tril. run-off in private sector shorter term credit demand and
there has been an outright $700 bil. collapse in the market for asset backed and finance co.
commercial paper. This degree of liquidation is unprecedented in the modern era.
The Fed waited through most of 2010 to see if a a rather moderate economic recovery
would trigger a rebound in private sector credit demand. It did not, and the Fed, concerned
about the sustainability of the recovery, opted to begin another large ($600 bil.) program
of quantitative easing to assure a significant measure of funding for the economy.
Whether they will actually need to buy the $600 bil. of Treasuries is an open question in
my book. The weekly leading indicators suggest the economy is set to regain faster growth
traction and if this occurs and credit demand responds in a more positive, normal fashion,
the Fed will have the option to consider slowing the printing press as credit demand takes
on its accustomed role in helping to drive the economy. If private sector caution continues
and households and businesses refrain from borrowing more, than the Fed will proceed
with its program through mid-2011. It will be up to the Fed to tackle the issue of finding
the "right" balance.
The stock market has been keenly cognizant of Fed balance sheet mangement activity over
the past 18 odd months. The last three substantial downdrafts in the stock market -- early
2009, mid 2009, and spring 2010 have all occurred during periods when the Fed was
temporarily shrinking its balance sheet. Likewise, the bull moves in the market over this
period have come when the Fed has been expanding its balance sheet, or has been
promising to. When credit demand is shrinking or is flat, investors know that the Fed is
the only game in town when it comes to providing liquidity to the system. In this regard,
I suspect that if credit demand does pick up, then equities players will become a little
less sensitive to the ups and downs of the Fed's balance sheet.
Saturday, November 13, 2010
Stock Market -- Investing
I regard investing in stocks as an enterprise with a minimum time frame of 5 years. I am not a
buy and hold advocate. Never have been. An investor should add to commitments when the
market is cheap up to reasonable and lighten positions when the market gets expensive.
There was no investment case to be made for stocks from the latter part of 1996 until the
end of 2008 in my view. I think there has been a good case for long term investment over
most of the past 18 months, with the early 2009 time frame the best time to invest for the
longer term since the early 1980s. As all know, the market has improved dramatically and
quickly since early last year, and although stocks are now far from cheap, I regard the market
as still being reasonable.
I am primarily a trader, but if I was a long term player, I would not be uncomfortable
making new commitments up to SP 500 1240 over the next year or so. That level works out
to 16 x long term trend earnings and about 14 x projected 2011 eps for the "500". If I was
only a long term player, I would be reluctant to add to holdings above the 1240 area. There
could be good trades from that level, but I think true longer term players should wait for
significant dips before committing.
My SP 500 Market Tracker has the SP 500 fairly valued at 1470 for year end 2011 on
a continuing but far less dramatic recovery of earnings to $89 per share. I watch the
performance of earnings in the context of a long term, static channel, and because of the
cyclicality of profits, I grow progressively more cautious about the market as earnings
expand up to the top of the channel or exceed it. Such happened over 1997 - 2001 and
again over mid 2006 - late 2007. The next challenge to the top of the eps channel would
appear to be several years away. I also keep an eye on the long term price channel
running back over 60 years. The channel top for 2011 for the SP 500 is about 1500 and,
in my view, long term players might use the 1450 - 1500 level to lighten the commitment
to equities should the market do that well.
Since investors have all manner of objectives, I never presume to offer advice. I let you
know my views and leave it to you decide whether the perspectives are of use. I would
say my strategies for longer term commitment to equities have been conservative and sound,
but do not register at all well with players who try to use market timing or trend following
in making longer term investments.
buy and hold advocate. Never have been. An investor should add to commitments when the
market is cheap up to reasonable and lighten positions when the market gets expensive.
There was no investment case to be made for stocks from the latter part of 1996 until the
end of 2008 in my view. I think there has been a good case for long term investment over
most of the past 18 months, with the early 2009 time frame the best time to invest for the
longer term since the early 1980s. As all know, the market has improved dramatically and
quickly since early last year, and although stocks are now far from cheap, I regard the market
as still being reasonable.
I am primarily a trader, but if I was a long term player, I would not be uncomfortable
making new commitments up to SP 500 1240 over the next year or so. That level works out
to 16 x long term trend earnings and about 14 x projected 2011 eps for the "500". If I was
only a long term player, I would be reluctant to add to holdings above the 1240 area. There
could be good trades from that level, but I think true longer term players should wait for
significant dips before committing.
My SP 500 Market Tracker has the SP 500 fairly valued at 1470 for year end 2011 on
a continuing but far less dramatic recovery of earnings to $89 per share. I watch the
performance of earnings in the context of a long term, static channel, and because of the
cyclicality of profits, I grow progressively more cautious about the market as earnings
expand up to the top of the channel or exceed it. Such happened over 1997 - 2001 and
again over mid 2006 - late 2007. The next challenge to the top of the eps channel would
appear to be several years away. I also keep an eye on the long term price channel
running back over 60 years. The channel top for 2011 for the SP 500 is about 1500 and,
in my view, long term players might use the 1450 - 1500 level to lighten the commitment
to equities should the market do that well.
Since investors have all manner of objectives, I never presume to offer advice. I let you
know my views and leave it to you decide whether the perspectives are of use. I would
say my strategies for longer term commitment to equities have been conservative and sound,
but do not register at all well with players who try to use market timing or trend following
in making longer term investments.
Wednesday, November 10, 2010
Stock Market -- Fundamentals
Summary
The stock market has a good shot at returning over 20% in price gain through 2011 provided
the pervasive sense of caution among households, businesses and the banks eases up enough
to allow the economy to function with more normalcy than we have witnessed so far in this
economic recovery. Business will play the most critical role as it must invest, hire and
compensate at more elevated rates if the economy is to recover prosperity. Investors have a
clear sense of skepticism about whether the economy can recover confidence and may not
be easily won over until there are more tangible signs of progress.
Core Indicators
The core group was positive but running out of gas until the Fed announced its new liquidity
injection program (QE '2). Now, the core indicator group will strengthen as the Fed assures
faster growth of monetary liquidity at least through mid 2011.
Secondary Indicators
Measured yr/yr, the growth of the $ value of both production and total business sales is
moderating. With quantitative monetary easing, there will be some acceleration of system
liquidity growth. Thus, the liquidity headwind will continue to moderate as the demands of
the real economy ease, allowing less of a strain on liquidity available to support the stock
market -- a plus.
The inflation adjusted or real oil price is again moving up sharply as financial traders have
jumped into the oil market to "play" QE '2. So far, the rapid recovery in the oil price since
early 2009 has not appeared to have inhibited the stock market.
Profits Growth Momentum
Following the initial recovery surge over late 2009 - mid 2010, profits growth momentum
although substantially positive has been decelerating and is likely to continue to do so
right through 2011. with slower profits growth ahead, investor confidence will become a
much larger factor in determining returns through 2011.
SP 500 Market Tracker (Modeled P/E Ratio X 12 mos. EPS)
My Tracker puts fair value for the "500" at 1370 for 2010 and 1470 for 2011. The SP 500 is
now trading at 1217, or about 11% below fair value for the model. This discount is a
direct and primary result of investor caution about just how good the earnings outlook is
for the global economy over the next year. In addition, investors continue to prefer smaller
US cap and faster growing foreign economies over the large cap "500", preferences that
have been in force over most of the prior decade.
Fundamental Weekly Coincident Market Indicator
This proprietary indicator advanced an amazing 62% off its deep cyclical low in 3/09 to
its cyclical high to date set 4/30/10 and supported the very rapid advance in the stock market
over the same interval. The indicator fell sharply from 4/30 until early Jul., 2010, and
following a consolidation phase, has been on an upswing since early Sept. So it has moved
in line with the recent rally in stocks and it points to an eventual re-acceleration of economic
growth. However, there is a "hall of mirrors" effect here as regards the indicator and the
stock market. For example, the indicator assigns a heavy weight to a broad basket of
sensitive materials prices such as copper, which, reflecting the financialization of the
commodities market, have mirrored stock price trends. So the unadulterated economic
content counts for less.
Longer Term Economic Indicators
This set of indicators shows there is substantial economic slack and that the economy has
the capacity to expand another 4-5 years easily if it can maintain reasonable balance. The
new round of liquidity injections planned by the Fed strengthens the case substantially
looking out through 2011. However, the indicators do not account for the psychological
states of consumers, businesses and the banks. Additional easing by the Fed provides a
financial framework for caution to abate and for all sectors to loosen up a little more
to realize rather moderate but decent economic potential. It is up to the private sector
now to follow through. The 11% discount of the SP 500 to the Market Tracker reflects
investor caution about just to what degree the economy will return to more normal
operations, with special focus on whether business will unlock and invest and hire
more people back.
The stock market has a good shot at returning over 20% in price gain through 2011 provided
the pervasive sense of caution among households, businesses and the banks eases up enough
to allow the economy to function with more normalcy than we have witnessed so far in this
economic recovery. Business will play the most critical role as it must invest, hire and
compensate at more elevated rates if the economy is to recover prosperity. Investors have a
clear sense of skepticism about whether the economy can recover confidence and may not
be easily won over until there are more tangible signs of progress.
Core Indicators
The core group was positive but running out of gas until the Fed announced its new liquidity
injection program (QE '2). Now, the core indicator group will strengthen as the Fed assures
faster growth of monetary liquidity at least through mid 2011.
Secondary Indicators
Measured yr/yr, the growth of the $ value of both production and total business sales is
moderating. With quantitative monetary easing, there will be some acceleration of system
liquidity growth. Thus, the liquidity headwind will continue to moderate as the demands of
the real economy ease, allowing less of a strain on liquidity available to support the stock
market -- a plus.
The inflation adjusted or real oil price is again moving up sharply as financial traders have
jumped into the oil market to "play" QE '2. So far, the rapid recovery in the oil price since
early 2009 has not appeared to have inhibited the stock market.
Profits Growth Momentum
Following the initial recovery surge over late 2009 - mid 2010, profits growth momentum
although substantially positive has been decelerating and is likely to continue to do so
right through 2011. with slower profits growth ahead, investor confidence will become a
much larger factor in determining returns through 2011.
SP 500 Market Tracker (Modeled P/E Ratio X 12 mos. EPS)
My Tracker puts fair value for the "500" at 1370 for 2010 and 1470 for 2011. The SP 500 is
now trading at 1217, or about 11% below fair value for the model. This discount is a
direct and primary result of investor caution about just how good the earnings outlook is
for the global economy over the next year. In addition, investors continue to prefer smaller
US cap and faster growing foreign economies over the large cap "500", preferences that
have been in force over most of the prior decade.
Fundamental Weekly Coincident Market Indicator
This proprietary indicator advanced an amazing 62% off its deep cyclical low in 3/09 to
its cyclical high to date set 4/30/10 and supported the very rapid advance in the stock market
over the same interval. The indicator fell sharply from 4/30 until early Jul., 2010, and
following a consolidation phase, has been on an upswing since early Sept. So it has moved
in line with the recent rally in stocks and it points to an eventual re-acceleration of economic
growth. However, there is a "hall of mirrors" effect here as regards the indicator and the
stock market. For example, the indicator assigns a heavy weight to a broad basket of
sensitive materials prices such as copper, which, reflecting the financialization of the
commodities market, have mirrored stock price trends. So the unadulterated economic
content counts for less.
Longer Term Economic Indicators
This set of indicators shows there is substantial economic slack and that the economy has
the capacity to expand another 4-5 years easily if it can maintain reasonable balance. The
new round of liquidity injections planned by the Fed strengthens the case substantially
looking out through 2011. However, the indicators do not account for the psychological
states of consumers, businesses and the banks. Additional easing by the Fed provides a
financial framework for caution to abate and for all sectors to loosen up a little more
to realize rather moderate but decent economic potential. It is up to the private sector
now to follow through. The 11% discount of the SP 500 to the Market Tracker reflects
investor caution about just to what degree the economy will return to more normal
operations, with special focus on whether business will unlock and invest and hire
more people back.
Subscribe to:
Posts (Atom)